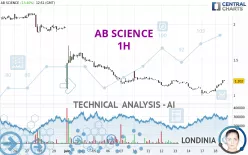
AB SCIENCE - 1H - Technical analysis published on 06/18/2024 (GMT)
- 142
- 0
Click here for a new analysis!
- Timeframe : 1H
- - Analysis generated on
- Status : INVALID

Summary of the analysis

Additional analysis
Quotes
The AB SCIENCE price is 1.196 EUR. The price has increased by +12.83% since the last closing with the lowest point at 1.060 EUR and the highest point at 1.200 EUR. The deviation from the price is +12.83% for the low point and -0.33% for the high point.So that you have an overall view of the price change, here is a table showing the variations over several periods:
New LOW record (5 years)
Type : Bearish
Timeframe : Weekly
Technical
Technical analysis of this 1H chart of AB SCIENCE indicates that the overall trend is slightly bearish. 57.14% of the signals given by moving averages are bearish. Caution: the strong bullish signals currently being given by short-term moving averages could quickly lead to a reversal of the trend. The Central Indicators market scanner is currently detecting a bullish signal that could impact this trend:
Bullish trend reversal : adaptative moving average 50
Type : Bullish
Timeframe : 1 hour
In fact, 16 technical indicators on 18 studied are currently positioned bullish. Caution: the Central Indicators scanner currently detects an excess:
CCI indicator is overbought : over 100
Type : Neutral
Timeframe : 1 hour
Williams %R indicator is overbought : over -20
Type : Neutral
Timeframe : 1 hour
Pivot points : price is over resistance 3
Type : Neutral
Timeframe : 1 hour
MACD indicator is back over 0
Type : Bullish
Timeframe : 1 hour
Price is back over the pivot point
Type : Bullish
Timeframe : Weekly
The analysis of the price chart with Central Patterns scanners does not return any result.
The presence of a bullish Japanese candlestick pattern detected by Central Candlesticks that could cause a very short term rebound was also detected:
Upside gap
Type : Bullish
Timeframe : 1 hour
| S2 | S1 | Price | R1 | R2 | R3 | |
|---|---|---|---|---|---|---|
| ProTrendLines | 1.002 | 1.125 | 1.196 | 1.963 | 2.153 | 2.285 |
| Change (%) | -16.22% | -5.94% | - | +64.13% | +80.02% | +91.05% |
| Change | -0.194 | -0.071 | - | +0.767 | +0.957 | +1.089 |
| Level | Intermediate | Minor | - | Intermediate | Major | Intermediate |
Attention could also be paid to pivot points to set price objectives:
| Pivot points | S3 | S2 | S1 | PP | R1 | R2 | R3 |
|---|---|---|---|---|---|---|---|
| Standard | 0.945 | 0.973 | 1.017 | 1.045 | 1.089 | 1.117 | 1.161 |
| Camarilla | 1.040 | 1.047 | 1.053 | 1.060 | 1.067 | 1.073 | 1.080 |
| Woodie | 0.952 | 0.977 | 1.024 | 1.049 | 1.096 | 1.121 | 1.168 |
| Fibonacci | 0.973 | 1.001 | 1.018 | 1.045 | 1.073 | 1.090 | 1.117 |
| Pivot points | S3 | S2 | S1 | PP | R1 | R2 | R3 |
|---|---|---|---|---|---|---|---|
| Standard | 0.730 | 0.900 | 1.000 | 1.170 | 1.270 | 1.440 | 1.540 |
| Camarilla | 1.026 | 1.051 | 1.075 | 1.100 | 1.125 | 1.150 | 1.174 |
| Woodie | 0.695 | 0.883 | 0.965 | 1.153 | 1.235 | 1.423 | 1.505 |
| Fibonacci | 0.900 | 1.003 | 1.067 | 1.170 | 1.273 | 1.337 | 1.440 |
| Pivot points | S3 | S2 | S1 | PP | R1 | R2 | R3 |
|---|---|---|---|---|---|---|---|
| Standard | 1.343 | 1.603 | 1.776 | 2.036 | 2.209 | 2.469 | 2.642 |
| Camarilla | 1.831 | 1.871 | 1.910 | 1.950 | 1.990 | 2.029 | 2.069 |
| Woodie | 1.301 | 1.581 | 1.734 | 2.014 | 2.167 | 2.447 | 2.600 |
| Fibonacci | 1.603 | 1.768 | 1.870 | 2.036 | 2.201 | 2.303 | 2.469 |
Numerical data
The following are the details of the technical indicators and moving averages that were collected to generate this technical analysis:
| RSI (14): | 67.27 | |
| MACD (12,26,9): | 0.0050 | |
| Directional Movement: | 25.362 | |
| AROON (14): | 100.000 | |
| DEMA (21): | 1.111 | |
| Parabolic SAR (0,02-0,02-0,2): | 1.037 | |
| Elder Ray (13): | 0.064 | |
| Super Trend (3,10): | 1.110 | |
| Zig ZAG (10): | 1.196 | |
| VORTEX (21): | 1.1190 | |
| Stochastique (14,3,5): | 97.46 | |
| TEMA (21): | 1.141 | |
| Williams %R (14): | -2.30 | |
| Chande Momentum Oscillator (20): | 0.138 | |
| Repulse (5,40,3): | 5.9680 | |
| ROCnROLL: | 1 | |
| TRIX (15,9): | -0.2010 | |
| Courbe Coppock: | 11.76 |
| MA7: | 1.169 | |
| MA20: | 1.570 | |
| MA50: | 1.865 | |
| MA100: | 2.355 | |
| MAexp7: | 1.142 | |
| MAexp20: | 1.114 | |
| MAexp50: | 1.155 | |
| MAexp100: | 1.288 | |
| Price / MA7: | +2.31% | |
| Price / MA20: | -23.82% | |
| Price / MA50: | -35.87% | |
| Price / MA100: | -49.21% | |
| Price / MAexp7: | +4.73% | |
| Price / MAexp20: | +7.36% | |
| Price / MAexp50: | +3.55% | |
| Price / MAexp100: | -7.14% |
News
Don't forget to follow the news on AB SCIENCE. At the time of publication of this analysis, the latest news was as follows:
- AB Science is providing a summary of the live webcast held on May 30, 2024, giving an update on the application for conditional marketing authorization of masitinib in ALS
- AB Science provides an update on the application for conditional marketing authorisation of masitinib in ALS
- AB Science reports its revenues for the year 2023 and provides an update on its activities
- AB Science announces issuance of a European patent for masitinib in the treatment of severe mastocytosis with protection until 2036
- AB Science : A new publication in the medical journal Muscle & Nerve validates the use of the rate of decline of ALSFR-S score (ΔFS) for the design of clinical studies and the treatment choice for amyotrophic lateral sclerosis (ALS) patient
About author
Online


Add a comment
Comments
0 comments on the analysis AB SCIENCE - 1H