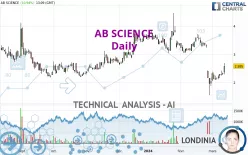
AB SCIENCE - Daily - Technical analysis published on 03/13/2024 (GMT)
- 171
- 0
Click here for a new analysis!
- Timeframe : Daily
- - Analysis generated on
- Status : TARGET REACHED

Summary of the analysis

Additional analysis
Quotes
AB SCIENCE rating 2.585 EUR. The price has increased by +10.94% since the last closing and was between 2.290 EUR and 2.690 EUR. This implies that the price is at +12.88% from its lowest and at -3.90% from its highest.The Central Gaps scanner detects a bullish gap which is a sign that buyers have taken the lead in the very short term.
Opening Gap UP
Type : Bullish
Timeframe : Openning
A study of price movements over other periods shows the following variations:
Technical
A technical analysis in Daily of this AB SCIENCE chart shows a bearish trend. 75.00% of the signals given by moving averages are bearish. The overall trend seems to be showing some signs of weakness, as do the tentative bearish signals from short-term moving averages. The Central Indicators market scanner is currently detecting a bullish signal that could impact this trend:
Bullish price crossover with adaptative moving average 20
Type : Bullish
Timeframe : Daily
In fact, according to the parameters integrated into the Central Analyzer system, only 8 technical indicators out of 18 analysed are currently bullish. Other results related to technical indicators were also found by the Central Indicators scanner:
Pivot points : price is over resistance 3
Type : Neutral
Timeframe : Daily
Pivot points : price is over resistance 3
Type : Neutral
Timeframe : Weekly
MACD crosses UP its Moving Average
Type : Bullish
Timeframe : Daily
Williams %R indicator is back over -50
Type : Bullish
Timeframe : Daily
The Central Patterns scanner, which studies chart patterns, resistances and supports, has identified this signal:
Near horizontal resistance
Type : Bearish
Timeframe : Daily
The Central Candlesticks scanner, specialised in Japanese candlesticks, did not identify any signals.
| S2 | S1 | Price | R1 | R2 | R3 | |
|---|---|---|---|---|---|---|
| ProTrendLines | 1.958 | 2.227 | 2.585 | 2.652 | 3.223 | 3.855 |
| Change (%) | -24.26% | -13.85% | - | +2.59% | +24.68% | +49.13% |
| Change | -0.627 | -0.358 | - | +0.067 | +0.638 | +1.270 |
| Level | Minor | Major | - | Minor | Major | Major |
To determine price objectives, it is also possible to use the pivot points. Here is the price position in relation to pivot points:
| Pivot points | S3 | S2 | S1 | PP | R1 | R2 | R3 |
|---|---|---|---|---|---|---|---|
| Standard | 2.188 | 2.227 | 2.278 | 2.317 | 2.368 | 2.407 | 2.458 |
| Camarilla | 2.305 | 2.314 | 2.322 | 2.330 | 2.338 | 2.347 | 2.355 |
| Woodie | 2.195 | 2.230 | 2.285 | 2.320 | 2.375 | 2.410 | 2.465 |
| Fibonacci | 2.227 | 2.261 | 2.282 | 2.317 | 2.351 | 2.372 | 2.407 |
| Pivot points | S3 | S2 | S1 | PP | R1 | R2 | R3 |
|---|---|---|---|---|---|---|---|
| Standard | 1.890 | 1.995 | 2.145 | 2.250 | 2.400 | 2.505 | 2.655 |
| Camarilla | 2.225 | 2.248 | 2.272 | 2.295 | 2.318 | 2.342 | 2.365 |
| Woodie | 1.913 | 2.006 | 2.168 | 2.261 | 2.423 | 2.516 | 2.678 |
| Fibonacci | 1.995 | 2.092 | 2.153 | 2.250 | 2.347 | 2.408 | 2.505 |
| Pivot points | S3 | S2 | S1 | PP | R1 | R2 | R3 |
|---|---|---|---|---|---|---|---|
| Standard | -1.010 | 0.270 | 1.160 | 2.440 | 3.330 | 4.610 | 5.500 |
| Camarilla | 1.453 | 1.652 | 1.851 | 2.050 | 2.249 | 2.448 | 2.647 |
| Woodie | -1.205 | 0.173 | 0.965 | 2.343 | 3.135 | 4.513 | 5.305 |
| Fibonacci | 0.270 | 1.099 | 1.611 | 2.440 | 3.269 | 3.781 | 4.610 |
Numerical data
The following are the details of the technical indicators and moving averages that were collected to generate this technical analysis:
| RSI (14): | 48.00 | |
| MACD (12,26,9): | -0.2550 | |
| Directional Movement: | -3.821 | |
| AROON (14): | -28.571 | |
| DEMA (21): | 2.273 | |
| Parabolic SAR (0,02-0,02-0,2): | 1.584 | |
| Elder Ray (13): | 0.026 | |
| Super Trend (3,10): | 2.751 | |
| Zig ZAG (10): | 2.635 | |
| VORTEX (21): | 0.9480 | |
| Stochastique (14,3,5): | 45.64 | |
| TEMA (21): | 2.127 | |
| Williams %R (14): | -43.90 | |
| Chande Momentum Oscillator (20): | -0.700 | |
| Repulse (5,40,3): | 12.6150 | |
| ROCnROLL: | -1 | |
| TRIX (15,9): | -1.2910 | |
| Courbe Coppock: | 56.35 |
| MA7: | 2.293 | |
| MA20: | 2.707 | |
| MA50: | 3.117 | |
| MA100: | 2.995 | |
| MAexp7: | 2.373 | |
| MAexp20: | 2.603 | |
| MAexp50: | 2.905 | |
| MAexp100: | 3.056 | |
| Price / MA7: | +12.73% | |
| Price / MA20: | -4.51% | |
| Price / MA50: | -17.07% | |
| Price / MA100: | -13.69% | |
| Price / MAexp7: | +8.93% | |
| Price / MAexp20: | -0.69% | |
| Price / MAexp50: | -11.02% | |
| Price / MAexp100: | -15.41% |
News
The last news published on AB SCIENCE at the time of the generation of this analysis was as follows:
- AB Science announces that two financial analysis firms, DNA Finance and In Extenso Finance, have initiated coverage of the Company
- AB Science announces that Health Canada has issued a Notice of Non-Compliance-Withdrawal (NON/w) for masitinib in ALS
- AB Science announces an update in the marketing authorization application of masitinib in amyotrophic lateral sclerosis at the European Medicines Agency
- AB Science: The clinical development of masitinib in sickle cell disease is among the 19 winning projects under the sixth call for “Hospital-Inuversity Research in health (RHU)”
- AB Science provides an update on the EMA timetable for examination of the masitinib marketing authorization application in ALS
About author
Online


Add a comment
Comments
0 comments on the analysis AB SCIENCE - Daily