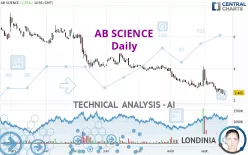
AB SCIENCE - Daily - Technical analysis published on 09/20/2023 (GMT)
- 202
- 0
Click here for a new analysis!
- Timeframe : Daily
- - Analysis generated on
- Status : TARGET REACHED

Summary of the analysis

Additional analysis
Quotes
AB SCIENCE rating 2.465 EUR. The price registered an increase of +2.07% on the session and was between 2.310 EUR and 2.470 EUR. This implies that the price is at +6.71% from its lowest and at -0.20% from its highest.The Central Gaps scanner detects a bullish opening. A small advantage for buyers in the very short term.
Bullish opening
Type : Bullish
Timeframe : Openning
Here is a more detailed summary of the historical variations registered by AB SCIENCE:
New LOW record (5 years)
Type : Bearish
Timeframe : Weekly
New LOW record (1 year)
Type : Bearish
Timeframe : Weekly
New LOW record (1st january)
Type : Bearish
Timeframe : Weekly
New LOW record (1 month)
Type : Bearish
Timeframe : Weekly
Abnormal volumes on AB SCIENCE were detected by the Central Volumes scanner:
Abnormal volumes
Timeframe : 20 days
Abnormal volumes
Timeframe : 50 days
Technical
A technical analysis in Daily of this AB SCIENCE chart shows a sharp bearish trend. The signals given by moving averages are 92.86% bearish. This strong bearish trend is confirmed by the strong signals currently being given by short-term moving averages. The Central Indicators market scanner currently does not detect any result that concerns moving averages.
In fact, 13 technical indicators on 18 studied are currently positioned bearish. But beware of excesses. The Central Indicators scanner currently detects this:
CCI indicator is oversold : under -100
Type : Neutral
Timeframe : Daily
Williams %R indicator is oversold : under -80
Type : Neutral
Timeframe : Daily
Central Patterns, the scanner specializing in chart patterns, did not identify any signals.
For a small rebound in the very short term, the Central Candlesticks scanner currently notes the presence of this bullish pattern in Japanese candlesticks:
Bullish harami
Type : Bullish
Timeframe : Daily
| Price | R1 | R2 | R3 | |
|---|---|---|---|---|
| ProTrendLines | 2.465 | 2.795 | 3.223 | 3.890 |
| Change (%) | - | +13.39% | +30.75% | +57.81% |
| Change | - | +0.330 | +0.758 | +1.425 |
| Level | - | Intermediate | Major | Intermediate |
Attention could also be paid to pivot points to set price objectives:
| Pivot points | S3 | S2 | S1 | PP | R1 | R2 | R3 |
|---|---|---|---|---|---|---|---|
| Standard | 2.062 | 2.238 | 2.327 | 2.503 | 2.592 | 2.768 | 2.857 |
| Camarilla | 2.342 | 2.366 | 2.391 | 2.415 | 2.439 | 2.464 | 2.488 |
| Woodie | 2.018 | 2.216 | 2.283 | 2.481 | 2.548 | 2.746 | 2.813 |
| Fibonacci | 2.238 | 2.340 | 2.402 | 2.503 | 2.605 | 2.667 | 2.768 |
| Pivot points | S3 | S2 | S1 | PP | R1 | R2 | R3 |
|---|---|---|---|---|---|---|---|
| Standard | 1.793 | 2.142 | 2.393 | 2.742 | 2.993 | 3.342 | 3.593 |
| Camarilla | 2.480 | 2.535 | 2.590 | 2.645 | 2.700 | 2.755 | 2.810 |
| Woodie | 1.745 | 2.118 | 2.345 | 2.718 | 2.945 | 3.318 | 3.545 |
| Fibonacci | 2.142 | 2.371 | 2.513 | 2.742 | 2.971 | 3.113 | 3.342 |
| Pivot points | S3 | S2 | S1 | PP | R1 | R2 | R3 |
|---|---|---|---|---|---|---|---|
| Standard | 1.657 | 2.193 | 3.047 | 3.583 | 4.437 | 4.973 | 5.827 |
| Camarilla | 3.518 | 3.645 | 3.773 | 3.900 | 4.027 | 4.155 | 4.282 |
| Woodie | 1.815 | 2.273 | 3.205 | 3.663 | 4.595 | 5.053 | 5.985 |
| Fibonacci | 2.193 | 2.724 | 3.052 | 3.583 | 4.114 | 4.442 | 4.973 |
Numerical data
The following is the status of the technical indicators and moving averages at the time of publication of this technical analysis:
| RSI (14): | 36.94 | |
| MACD (12,26,9): | -0.2260 | |
| Directional Movement: | -10.116 | |
| AROON (14): | -100.000 | |
| DEMA (21): | 2.543 | |
| Parabolic SAR (0,02-0,02-0,2): | 3.542 | |
| Elder Ray (13): | -0.326 | |
| Super Trend (3,10): | 3.130 | |
| Zig ZAG (10): | 2.470 | |
| VORTEX (21): | 0.9050 | |
| Stochastique (14,3,5): | 3.43 | |
| TEMA (21): | 2.508 | |
| Williams %R (14): | -90.61 | |
| Chande Momentum Oscillator (20): | -0.550 | |
| Repulse (5,40,3): | -13.8430 | |
| ROCnROLL: | 2 | |
| TRIX (15,9): | -0.8150 | |
| Courbe Coppock: | 33.15 |
| MA7: | 2.558 | |
| MA20: | 2.890 | |
| MA50: | 3.293 | |
| MA100: | 3.880 | |
| MAexp7: | 2.582 | |
| MAexp20: | 2.834 | |
| MAexp50: | 3.257 | |
| MAexp100: | 3.916 | |
| Price / MA7: | -3.64% | |
| Price / MA20: | -14.71% | |
| Price / MA50: | -25.14% | |
| Price / MA100: | -36.47% | |
| Price / MAexp7: | -4.53% | |
| Price / MAexp20: | -13.02% | |
| Price / MAexp50: | -24.32% | |
| Price / MAexp100: | -37.05% |
News
The last news published on AB SCIENCE at the time of the generation of this analysis was as follows:
- AB Science provides an update on the EMA timetable for examination of the masitinib marketing authorization application in ALS
- AB Science announces issuance of a Canadian patent for masitinib in the treatment of ALS with protection until 2037
- AB Science summarizes key messages from its participation to a panel discussion at the 2023 ALS Drug Development Summit
- AB Science - Summary of the presentation on masitinib in ALS delivered at 2023 AAN Annual Meeting
- AB Science announces the success of its capital increase by private placement for an amount of 15 million euros
About author
Online


Add a comment
Comments
0 comments on the analysis AB SCIENCE - Daily