| Open: | 3.20 |
| Change: | -0.25 |
| Volume: | 18,228,956 |
| Low: | 3.09 |
| High: | 3.26 |
| High / Low range: | 0.17 |
| Type: | Stocks |
| Ticker: | AB |
| ISIN: | FR0010557264 |
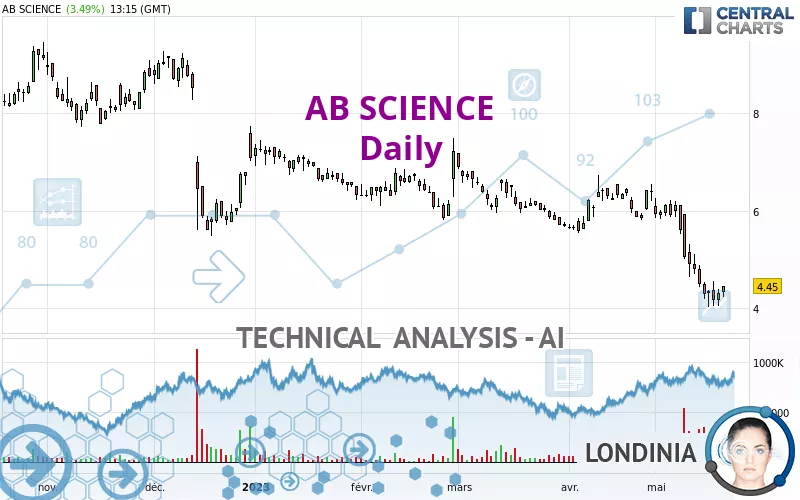
AB SCIENCE - Daily - Technical analysis published on 05/22/2023 (GMT)
- 225
- 0
- 05/22/2023 - 13:35
Click here for a new analysis!
- Timeframe : Daily
- - Analysis generated on 05/22/2023 - 13:35
- Status : LEVEL MAINTAINED

Summary of the analysis

Additional analysis
Quotes
The AB SCIENCE rating is 4.450 EUR. The price has increased by +3.49% since the last closing with the lowest point at 4.220 EUR and the highest point at 4.460 EUR. The deviation from the price is +5.45% for the low point and -0.22% for the high point.The Central Gaps scanner detects a bullish opening. A small advantage for buyers in the very short term.
Bullish opening
Type : Bullish
Timeframe : Openning
So that you have an overall view of the price change, here is a table showing the variations over several periods:
Near a new LOW record (1 year)
Type : Bearish
Timeframe : Weekly
Near a new LOW record (1st january)
Type : Bearish
Timeframe : Weekly
Near a new LOW record (1 month)
Type : Bearish
Timeframe : Weekly
Abnormal volumes on AB SCIENCE were detected by the Central Volumes scanner:
Abnormal volumes
Timeframe : 5 days
Abnormal volumes
Timeframe : 20 days
Technical
Technical analysis of AB SCIENCE in Daily shows a overall strongly bearish trend. 92.86% of the signals given by moving averages are bearish. This strongly bearish trend is supported by the strong bearish signals given by short-term moving averages. There is no crossing of moving average by the price or crossing of moving averages between themselves.
In fact, Central Analyzer took into account 18 technical indicators and the result was as follows: 6 are bullish, 3 are neutral and 9 are bearish. Caution: the Central Indicators scanner currently detects an excess:
Williams %R indicator is oversold : under -80
Type : Neutral
Timeframe : Daily
Pivot points : price is over resistance 1
Type : Neutral
Timeframe : Daily
Price is back over the pivot point
Type : Bullish
Timeframe : Weekly
Central Patterns, the scanner specializing in chart patterns, did not identify any signals.
The Central Candlesticks scanner which studies Japanese candlesticks did not detect anything.
| S1 | Price | R1 | R2 | R3 | |
|---|---|---|---|---|---|
| ProTrendLines | 3.223 | 4.450 | 4.825 | 5.852 | 7.294 |
| Change (%) | -27.57% | - | +8.43% | +31.51% | +63.91% |
| Change | -1.227 | - | +0.375 | +1.402 | +2.844 |
| Level | Major | - | Intermediate | Major | Major |
Pivot points can also be used to set your price objectives. Here is the price situation in relation to pivot points:
| Pivot points | S3 | S2 | S1 | PP | R1 | R2 | R3 |
|---|---|---|---|---|---|---|---|
| Standard | 3.763 | 3.907 | 4.103 | 4.247 | 4.443 | 4.587 | 4.783 |
| Camarilla | 4.207 | 4.238 | 4.269 | 4.300 | 4.331 | 4.362 | 4.394 |
| Woodie | 3.790 | 3.920 | 4.130 | 4.260 | 4.470 | 4.600 | 4.810 |
| Fibonacci | 3.907 | 4.037 | 4.117 | 4.247 | 4.377 | 4.457 | 4.587 |
| Pivot points | S3 | S2 | S1 | PP | R1 | R2 | R3 |
|---|---|---|---|---|---|---|---|
| Standard | 3.053 | 3.537 | 3.918 | 4.402 | 4.783 | 5.267 | 5.648 |
| Camarilla | 4.062 | 4.141 | 4.221 | 4.300 | 4.379 | 4.459 | 4.538 |
| Woodie | 3.003 | 3.511 | 3.868 | 4.376 | 4.733 | 5.241 | 5.598 |
| Fibonacci | 3.537 | 3.867 | 4.071 | 4.402 | 4.732 | 4.936 | 5.267 |
| Pivot points | S3 | S2 | S1 | PP | R1 | R2 | R3 |
|---|---|---|---|---|---|---|---|
| Standard | 4.543 | 5.047 | 5.723 | 6.227 | 6.903 | 7.407 | 8.083 |
| Camarilla | 6.076 | 6.184 | 6.292 | 6.400 | 6.508 | 6.616 | 6.725 |
| Woodie | 4.630 | 5.090 | 5.810 | 6.270 | 6.990 | 7.450 | 8.170 |
| Fibonacci | 5.047 | 5.497 | 5.776 | 6.227 | 6.677 | 6.956 | 7.407 |
Numerical data
The following is the status of technical indicators and moving averages registered at the time this technical analysis was created:
| RSI (14): | 32.86 | |
| MACD (12,26,9): | -0.4900 | |
| Directional Movement: | -15.073 | |
| AROON (14): | -78.571 | |
| DEMA (21): | 4.541 | |
| Parabolic SAR (0,02-0,02-0,2): | 4.936 | |
| Elder Ray (13): | -0.502 | |
| Super Trend (3,10): | 5.420 | |
| Zig ZAG (10): | 4.450 | |
| VORTEX (21): | 0.7040 | |
| Stochastique (14,3,5): | 12.53 | |
| TEMA (21): | 4.223 | |
| Williams %R (14): | -80.46 | |
| Chande Momentum Oscillator (20): | -1.660 | |
| Repulse (5,40,3): | 2.2900 | |
| ROCnROLL: | 2 | |
| TRIX (15,9): | -0.8500 | |
| Courbe Coppock: | 54.14 |
| MA7: | 4.406 | |
| MA20: | 5.351 | |
| MA50: | 5.804 | |
| MA100: | 6.246 | |
| MAexp7: | 4.519 | |
| MAexp20: | 5.118 | |
| MAexp50: | 5.687 | |
| MAexp100: | 6.206 | |
| Price / MA7: | +1.00% | |
| Price / MA20: | -16.84% | |
| Price / MA50: | -23.33% | |
| Price / MA100: | -28.75% | |
| Price / MAexp7: | -1.53% | |
| Price / MAexp20: | -13.05% | |
| Price / MAexp50: | -21.75% | |
| Price / MAexp100: | -28.30% |
News
The last news published on AB SCIENCE at the time of the generation of this analysis was as follows:
- 05/17/2023 - 18:14 AB Science summarizes key messages from its participation to a panel discussion at the 2023 ALS Drug Development Summit
- 04/27/2023 - 18:41 AB Science - Summary of the presentation on masitinib in ALS delivered at 2023 AAN Annual Meeting
- 04/24/2023 - 06:05 AB Science announces the success of its capital increase by private placement for an amount of 15 million euros
- 04/18/2023 - 16:55 AB Science announces masitinib patent granted in Japan for the treatment of amyotrophic lateral sclerosis, strengthening the Company’s intellectual property position until 2037
- 04/12/2023 - 16:23 AB Science: Results of masitinib in ALS selected for a scientific platform presentation at the AAN 2023, including long-term survival analysis and a new analysis of patient population with no complete loss of function at baseline
About author
Online


Add a comment
Comments
0 comments on the analysis AB SCIENCE - Daily