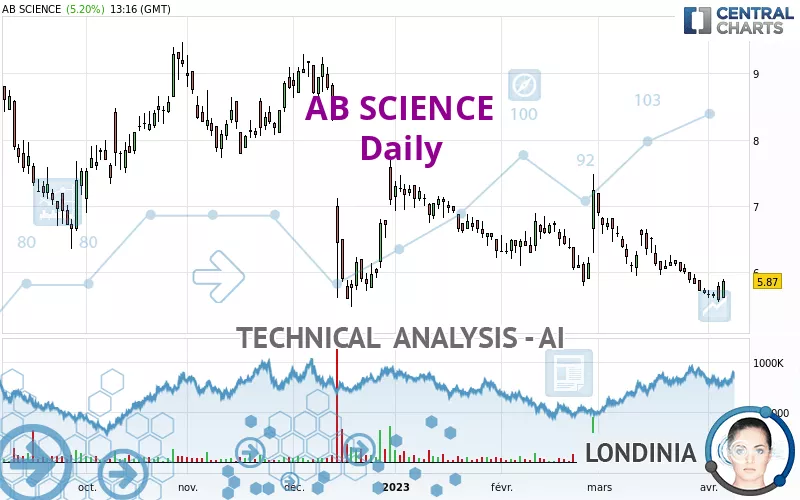
AB SCIENCE - Daily - Technical analysis published on 04/06/2023 (GMT)
- 209
- 0
Click here for a new analysis!
- Timeframe : Daily
- - Analysis generated on
- Status : LEVEL MAINTAINED

Summary of the analysis

Additional analysis
Quotes
The AB SCIENCE rating is 5.87 EUR. The price has increased by +5.20% since the last closing and was between 5.62 EUR and 5.90 EUR. This implies that the price is at +4.45% from its lowest and at -0.51% from its highest.A study of price movements over other periods shows the following variations:
Near a new LOW record (1 year)
Type : Bearish
Timeframe : Weekly
Near a new LOW record (1st january)
Type : Bearish
Timeframe : Weekly
Near a new LOW record (1 month)
Type : Bearish
Timeframe : Weekly
Technical
A technical analysis in Daily of this AB SCIENCE chart shows a sharp bearish trend. 92.86% of the signals given by moving averages are bearish. The overall trend is supported by the strong bearish signals from short-term moving averages. There is no crossing of moving average by the price or crossing of moving averages between themselves.
In fact, Central Analyzer took into account 18 technical indicators and the result was as follows: 6 are bullish, 5 are neutral and 7 are bearish. Central Indicators, the scanner specialised in technical indicators, has identified these signals:
Pivot points : price is over resistance 1
Type : Neutral
Timeframe : Daily
Price is back over the pivot point
Type : Bullish
Timeframe : Weekly
Central Patterns, the market scanner focusing on chart patterns, resistances and supports found this result:
Near horizontal resistance
Type : Bearish
Timeframe : Daily
The Central Candlesticks scanner which studies Japanese candlesticks did not detect anything.
| S3 | S2 | S1 | Price | R1 | R2 | R3 | |
|---|---|---|---|---|---|---|---|
| ProTrendLines | 3.22 | 4.83 | 5.84 | 5.87 | 7.30 | 8.45 | 9.39 |
| Change (%) | -45.09% | -17.80% | -0.48% | - | +24.33% | +43.87% | +59.88% |
| Change | -2.65 | -1.05 | -0.03 | - | +1.43 | +2.58 | +3.52 |
| Level | Major | Intermediate | Intermediate | - | Major | Minor | Intermediate |
Pivot points can also be used to set your price objectives. Here is the price situation in relation to pivot points:
| Pivot points | S3 | S2 | S1 | PP | R1 | R2 | R3 |
|---|---|---|---|---|---|---|---|
| Standard | 5.17 | 5.36 | 5.47 | 5.66 | 5.77 | 5.96 | 6.07 |
| Camarilla | 5.50 | 5.53 | 5.55 | 5.58 | 5.61 | 5.64 | 5.66 |
| Woodie | 5.13 | 5.34 | 5.43 | 5.64 | 5.73 | 5.94 | 6.03 |
| Fibonacci | 5.36 | 5.48 | 5.55 | 5.66 | 5.78 | 5.85 | 5.96 |
| Pivot points | S3 | S2 | S1 | PP | R1 | R2 | R3 |
|---|---|---|---|---|---|---|---|
| Standard | 5.11 | 5.40 | 5.54 | 5.83 | 5.97 | 6.26 | 6.40 |
| Camarilla | 5.57 | 5.61 | 5.65 | 5.69 | 5.73 | 5.77 | 5.81 |
| Woodie | 5.05 | 5.36 | 5.48 | 5.79 | 5.91 | 6.22 | 6.34 |
| Fibonacci | 5.40 | 5.56 | 5.66 | 5.83 | 5.99 | 6.09 | 6.26 |
| Pivot points | S3 | S2 | S1 | PP | R1 | R2 | R3 |
|---|---|---|---|---|---|---|---|
| Standard | 3.67 | 4.68 | 5.18 | 6.19 | 6.69 | 7.70 | 8.20 |
| Camarilla | 5.28 | 5.41 | 5.55 | 5.69 | 5.83 | 5.97 | 6.11 |
| Woodie | 3.43 | 4.55 | 4.94 | 6.06 | 6.45 | 7.57 | 7.96 |
| Fibonacci | 4.68 | 5.25 | 5.61 | 6.19 | 6.76 | 7.12 | 7.70 |
Numerical data
The following are the details of the technical indicators and moving averages that were collected to generate this technical analysis:
| RSI (14): | 44.92 | |
| MACD (12,26,9): | -0.2000 | |
| Directional Movement: | -6.70 | |
| AROON (14): | -92.86 | |
| DEMA (21): | 5.72 | |
| Parabolic SAR (0,02-0,02-0,2): | 6.15 | |
| Elder Ray (13): | -0.12 | |
| Super Trend (3,10): | 6.23 | |
| Zig ZAG (10): | 5.89 | |
| VORTEX (21): | 0.7600 | |
| Stochastique (14,3,5): | 18.36 | |
| TEMA (21): | 5.65 | |
| Williams %R (14): | -52.78 | |
| Chande Momentum Oscillator (20): | -0.21 | |
| Repulse (5,40,3): | 1.1000 | |
| ROCnROLL: | -1 | |
| TRIX (15,9): | -0.4000 | |
| Courbe Coppock: | 16.98 |
| MA7: | 5.71 | |
| MA20: | 6.01 | |
| MA50: | 6.30 | |
| MA100: | 6.85 | |
| MAexp7: | 5.76 | |
| MAexp20: | 5.97 | |
| MAexp50: | 6.30 | |
| MAexp100: | 6.75 | |
| Price / MA7: | +2.80% | |
| Price / MA20: | -2.33% | |
| Price / MA50: | -6.83% | |
| Price / MA100: | -14.31% | |
| Price / MAexp7: | +1.91% | |
| Price / MAexp20: | -1.68% | |
| Price / MAexp50: | -6.83% | |
| Price / MAexp100: | -13.04% |
News
The latest news and videos published on AB SCIENCE at the time of the analysis were as follows:
- AB Science announces that it has submitted its response to the day 120 questions in the EMA regulatory review of masitinib in amyotrophic lateral sclerosis and clarifies the new timeline for responding to Health Canada
- AB Science reports a first complete bone marrow response in a relapsed refractory acute myeloid leukemia patient from the very low dose arm of its AB8939 Phase I/II clinical trial (AB18001)
- AB Science announced the publication of the masitinib pivotal phase 3 clinical trial in Alzheimer’s Disease in the journal Alzheimer's Research & Therapy
- AB Science announces the drawdown of the second tranche of 6 million euros under its financing agreement with the European Investment Bank
- AB Science has received approval from the U.S. Food and Drug Administration (FDA) to initiate the confirmatory Phase 3 study with masitinib in the treatment of progressive multiple sclerosis
About author
Online


Add a comment
Comments
0 comments on the analysis AB SCIENCE - Daily