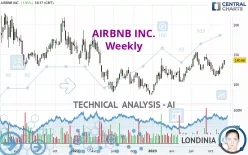
AIRBNB INC. - Weekly - Technical analysis published on 12/07/2023 (GMT)
- 281
- 0
Click here for a new analysis!
- Timeframe : Weekly
- - Analysis generated on
- Status : TARGET REACHED

Summary of the analysis

Additional analysis
Quotes
The AIRBNB INC. rating is 140.66 USD. Over 5 days, this instrument gained +11.33% and has been traded over the last 5 days between 132.66 USD and 141.05 USD. This implies that the 5 day price is +6.03% from its lowest point and -0.28% from its highest point.A bullish opening was detected by the Central Gaps scanner. Buyers are trying to impose a bullish momentum in the very short term.
Bullish opening
Type : Bullish
Timeframe : Openning
A study of price movements over other periods shows the following variations:
New HIGH record (1 month)
Type : Bullish
Timeframe : Weekly
Technical
Technical analysis of this Weekly chart of AIRBNB INC. indicates that the overall trend is bullish. The signals given by moving averages are 67.86% bullish. This bullish trend is slowing down slightly given the slightly bullish signals of short-term moving averages. An assessment of moving averages reveals a bullish signal that could impact this trend:
Bullish trend reversal : adaptative moving average 100
Type : Bullish
Timeframe : Weekly
In fact, 13 technical indicators on 18 studied are currently bullish. Central Indicators, the scanner specialised in technical indicators, has identified these signals:
Pivot points : price is over resistance 1
Type : Neutral
Timeframe : Weekly
MACD crosses UP its Moving Average
Type : Bullish
Timeframe : Weekly
Parabolic SAR indicator bullish reversal
Type : Bullish
Timeframe : Weekly
An analysis of the price chart with the Central Patterns scanner (detector of chart patterns and resistances and supports) shows a result that can have an impact on the price change:
Near resistance of channel
Type : Bearish
Timeframe : Weekly
The presence of a bullish Japanese candlestick pattern detected by Central Candlesticks that could cause a very short term rebound was also detected:
Three white soldiers
Type : Bullish
Timeframe : Weekly
| S3 | S2 | S1 | Price | R1 | R2 | R3 | |
|---|---|---|---|---|---|---|---|
| ProTrendLines | 89.08 | 114.09 | 131.94 | 140.66 | 153.29 | 186.64 | 207.21 |
| Change (%) | -36.67% | -18.89% | -6.20% | - | +8.98% | +32.69% | +47.31% |
| Change | -51.58 | -26.57 | -8.72 | - | +12.63 | +45.98 | +66.55 |
| Level | Minor | Major | Major | - | Major | Minor | Intermediate |
Pivot points can also be used to set your price objectives. Here is the price situation in relation to pivot points:
| Pivot points | S3 | S2 | S1 | PP | R1 | R2 | R3 |
|---|---|---|---|---|---|---|---|
| Standard | 130.80 | 132.97 | 134.14 | 136.31 | 137.48 | 139.65 | 140.82 |
| Camarilla | 134.39 | 134.70 | 135.00 | 135.31 | 135.62 | 135.92 | 136.23 |
| Woodie | 130.30 | 132.72 | 133.64 | 136.06 | 136.98 | 139.40 | 140.32 |
| Fibonacci | 132.97 | 134.25 | 135.03 | 136.31 | 137.59 | 138.37 | 139.65 |
| Pivot points | S3 | S2 | S1 | PP | R1 | R2 | R3 |
|---|---|---|---|---|---|---|---|
| Standard | 117.92 | 121.50 | 128.26 | 131.84 | 138.60 | 142.18 | 148.94 |
| Camarilla | 132.18 | 133.12 | 134.07 | 135.02 | 135.97 | 136.92 | 137.86 |
| Woodie | 119.51 | 122.30 | 129.85 | 132.64 | 140.19 | 142.98 | 150.53 |
| Fibonacci | 121.50 | 125.45 | 127.89 | 131.84 | 135.79 | 138.23 | 142.18 |
| Pivot points | S3 | S2 | S1 | PP | R1 | R2 | R3 |
|---|---|---|---|---|---|---|---|
| Standard | 98.90 | 106.50 | 116.42 | 124.02 | 133.94 | 141.54 | 151.46 |
| Camarilla | 121.52 | 123.13 | 124.73 | 126.34 | 127.95 | 129.55 | 131.16 |
| Woodie | 100.06 | 107.08 | 117.58 | 124.60 | 135.10 | 142.12 | 152.62 |
| Fibonacci | 106.50 | 113.19 | 117.33 | 124.02 | 130.71 | 134.85 | 141.54 |
Numerical data
The following is the status of the technical indicators and moving averages at the time of publication of this technical analysis:
| RSI (14): | 57.83 | |
| MACD (12,26,9): | 1.4900 | |
| Directional Movement: | 8.61 | |
| AROON (14): | -42.85 | |
| DEMA (21): | 130.96 | |
| Parabolic SAR (0,02-0,02-0,2): | 113.24 | |
| Elder Ray (13): | 7.54 | |
| Super Trend (3,10): | 151.84 | |
| Zig ZAG (10): | 140.45 | |
| VORTEX (21): | 0.9900 | |
| Stochastique (14,3,5): | 56.46 | |
| TEMA (21): | 129.82 | |
| Williams %R (14): | -27.67 | |
| Chande Momentum Oscillator (20): | -2.12 | |
| Repulse (5,40,3): | 13.7300 | |
| ROCnROLL: | 1 | |
| TRIX (15,9): | 0.1600 | |
| Courbe Coppock: | 10.10 |
| MA7: | 133.03 | |
| MA20: | 128.16 | |
| MA50: | 125.38 | |
| MA100: | 131.89 | |
| MAexp7: | 130.70 | |
| MAexp20: | 128.70 | |
| MAexp50: | 125.80 | |
| MAexp100: | 131.85 | |
| Price / MA7: | +5.74% | |
| Price / MA20: | +9.75% | |
| Price / MA50: | +12.19% | |
| Price / MA100: | +6.65% | |
| Price / MAexp7: | +7.62% | |
| Price / MAexp20: | +9.29% | |
| Price / MAexp50: | +11.81% | |
| Price / MAexp100: | +6.68% |
About author

Online


Add a comment
Comments
0 comments on the analysis AIRBNB INC. - Weekly