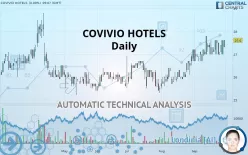
COVIVIO HOTELS - Daily - Technical analysis published on 09/30/2019 (GMT)
- 239
- 0
- Who voted?
Click here for a new analysis!
- Timeframe : Daily
- - Analysis generated on
- Status : TARGET REACHED

Summary of the analysis

Additional analysis
Quotes
The COVIVIO HOTELS rating is 27.6 EUR. The price registered an increase of +0.00% on the session and was traded between 27.3 EUR and 27.6 EUR over the period. The price is currently at +1.10% from its lowest and 0% from its highest.The Central Gaps scanner detects a bearish opening. A small advantage for sellers in the very short term.
Bearish opening
Type : Bearish
Timeframe : Openning
A study of price movements over other periods shows the following variations:
Near a new HIGH record (5 years)
Type : Bullish
Timeframe : Weekly
Near a new HIGH record (1st january)
Type : Bullish
Timeframe : Weekly
Technical
A technical analysis in Daily of this COVIVIO HOTELS chart shows a strongly bullish trend. 92.86% of the signals given by moving averages are bullish. This strongly bullish trend is supported by the strong bullish signals given by short-term moving averages. There is no crossing of moving average by the price or crossing of moving averages between themselves.
In fact, 12 technical indicators on 18 studied are currently positioned bullish. But beware of excesses. The Central Indicators scanner currently detects this:
CCI indicator is overbought : over 100
Type : Neutral
Timeframe : Daily
Williams %R indicator is overbought : over -20
Type : Neutral
Timeframe : Daily
Price is back over the pivot point
Type : Bullish
Timeframe : Daily
Central Patterns, the market scanner focusing on chart patterns, resistances and supports found these results:
Near horizontal resistance
Type : Bearish
Timeframe : Daily
Near resistance of channel
Type : Bearish
Timeframe : Daily
The Central Candlesticks scanner, specialised in Japanese candlesticks, did not identify any signals.
| S3 | S2 | S1 | Price | R1 | R2 | R3 | |
|---|---|---|---|---|---|---|---|
| ProTrendLines | 24.7 | 25.4 | 26.7 | 27.6 | 27.8 | 28.3 | 29.7 |
| Change (%) | -10.51% | -7.97% | -3.26% | - | +0.72% | +2.54% | +7.61% |
| Change | -2.9 | -2.2 | -0.9 | - | +0.2 | +0.7 | +2.1 |
| Level | Intermediate | Major | Intermediate | - | Minor | Major | Minor |
To determine price objectives, it is also possible to use the pivot points. Here is the price position in relation to pivot points:
| Pivot points | S3 | S2 | S1 | PP | R1 | R2 | R3 |
|---|---|---|---|---|---|---|---|
| Standard | 26.6 | 26.8 | 27.2 | 27.4 | 27.8 | 28.0 | 28.4 |
| Camarilla | 27.4 | 27.5 | 27.6 | 27.6 | 27.7 | 27.7 | 27.8 |
| Woodie | 26.7 | 26.9 | 27.3 | 27.5 | 27.9 | 28.1 | 28.5 |
| Fibonacci | 26.8 | 27.0 | 27.2 | 27.4 | 27.6 | 27.8 | 28.0 |
| Pivot points | S3 | S2 | S1 | PP | R1 | R2 | R3 |
|---|---|---|---|---|---|---|---|
| Standard | 24.4 | 24.9 | 26.1 | 26.6 | 27.8 | 28.3 | 29.5 |
| Camarilla | 26.7 | 26.9 | 27.0 | 27.2 | 27.4 | 27.5 | 27.7 |
| Woodie | 24.7 | 25.1 | 26.4 | 26.8 | 28.1 | 28.5 | 29.8 |
| Fibonacci | 24.9 | 25.6 | 26.0 | 26.6 | 27.3 | 27.7 | 28.3 |
Numerical data
The following is the status of technical indicators and moving averages registered at the time this technical analysis was created:
| RSI (14): | 59.60 | |
| MACD (12,26,9): | 0.2000 | |
| Directional Movement: | 18.5 | |
| AROON (14): | 14.3 | |
| DEMA (21): | 27.5 | |
| Parabolic SAR (0,02-0,02-0,2): | 27.0 | |
| Elder Ray (13): | 0.2 | |
| Super Trend (3,10): | 26.2 | |
| Zig ZAG (10): | 27.6 | |
| VORTEX (21): | 1.0000 | |
| Stochastique (14,3,5): | 72.10 | |
| TEMA (21): | 27.5 | |
| Williams %R (14): | -25.00 | |
| Chande Momentum Oscillator (20): | -0.2 | |
| Repulse (5,40,3): | 3.6000 | |
| ROCnROLL: | 1 | |
| TRIX (15,9): | 0.1000 | |
| Courbe Coppock: | 2.00 |
| MA7: | 27.4 | |
| MA20: | 27.2 | |
| MA50: | 26.5 | |
| MA100: | 26.3 | |
| MAexp7: | 27.4 | |
| MAexp20: | 27.2 | |
| MAexp50: | 26.8 | |
| MAexp100: | 26.5 | |
| Price / MA7: | +0.73% | |
| Price / MA20: | +1.47% | |
| Price / MA50: | +4.15% | |
| Price / MA100: | +4.94% | |
| Price / MAexp7: | +0.73% | |
| Price / MAexp20: | +1.47% | |
| Price / MAexp50: | +2.99% | |
| Price / MAexp100: | +4.15% |
News
Don"t forget to follow the news on COVIVIO HOTELS. At the time of publication of this analysis, the latest news was as follows:
 Fonciere des Murs
About author

Online


Add a comment
Comments
0 comments on the analysis COVIVIO HOTELS - Daily