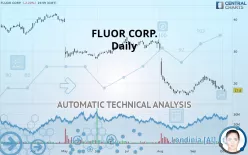
FLUOR CORP. - Daily - Technical analysis published on 10/02/2019 (GMT)
- 297
- 0
- Who voted?
Click here for a new analysis!
- Timeframe : Daily
- - Analysis generated on
- Status : INVALID

Summary of the analysis

Additional analysis
Quotes
The FLUOR CORP. rating is 17.80 USD. The price is lower by -2.20% since the last closing with the lowest point at 17.45 USD and the highest point at 18.20 USD. The deviation from the price is +2.01% for the low point and -2.20% for the high point.The Central Gaps scanner detects a bearish gap which is a sign that the sellers have taken the lead in the very short term.
Opening Gap DOWN
Type : Bearish
Timeframe : Openning
Here is a more detailed summary of the historical variations registered by FLUOR CORP.:
Near a new LOW record (1 month)
Type : Bearish
Timeframe : Weekly
Technical
Technical analysis of FLUOR CORP. in Daily shows a overall strongly bearish trend. The signals given by moving averages are 92.86% bearish. This strong bearish trend is confirmed by the strong signals currently being given by short-term moving averages. The Central Indicators scanner does not detect any result on moving averages that would impact this trend.
On the 18 technical indicators analysed, 4 are bullish, 1 are neutral and 13 are bearish. Caution: the Central Indicators scanner currently detects an excess:
Williams %R indicator is oversold : under -80
Type : Neutral
Timeframe : Daily
Price is back under the pivot point
Type : Bearish
Timeframe : Daily
Price is back under the pivot point
Type : Bearish
Timeframe : Weekly
No signals are given by Central Patterns, a market scanner specialised in chart patterns, resistances and supports.
For a small setback in the very short term, the Central Candlesticks scanner currently notes the presence of this bearish pattern in Japanese candlesticks:
Bearish engulfing lines
Type : Bearish
Timeframe : Daily
| S1 | Price | R1 | R2 | R3 | |
|---|---|---|---|---|---|
| ProTrendLines | 16.35 | 17.80 | 18.42 | 21.91 | 27.72 |
| Change (%) | -8.15% | - | +3.48% | +23.09% | +55.73% |
| Change | -1.45 | - | +0.62 | +4.11 | +9.92 |
| Level | Major | - | Major | Minor | Minor |
Pivot points can also be used to set your price objectives. Here is the price situation in relation to pivot points:
| Pivot points | S3 | S2 | S1 | PP | R1 | R2 | R3 |
|---|---|---|---|---|---|---|---|
| Standard | 16.10 | 17.06 | 17.63 | 18.59 | 19.16 | 20.12 | 20.69 |
| Camarilla | 17.78 | 17.92 | 18.06 | 18.20 | 18.34 | 18.48 | 18.62 |
| Woodie | 15.91 | 16.96 | 17.44 | 18.49 | 18.97 | 20.02 | 20.50 |
| Fibonacci | 17.06 | 17.64 | 18.01 | 18.59 | 19.17 | 19.54 | 20.12 |
| Pivot points | S3 | S2 | S1 | PP | R1 | R2 | R3 |
|---|---|---|---|---|---|---|---|
| Standard | 14.88 | 16.55 | 17.55 | 19.22 | 20.22 | 21.89 | 22.89 |
| Camarilla | 17.83 | 18.07 | 18.32 | 18.56 | 18.81 | 19.05 | 19.29 |
| Woodie | 14.56 | 16.38 | 17.23 | 19.05 | 19.90 | 21.72 | 22.57 |
| Fibonacci | 16.55 | 17.57 | 18.20 | 19.22 | 20.24 | 20.87 | 21.89 |
| Pivot points | S3 | S2 | S1 | PP | R1 | R2 | R3 |
|---|---|---|---|---|---|---|---|
| Standard | 11.12 | 14.06 | 16.60 | 19.54 | 22.08 | 25.02 | 27.56 |
| Camarilla | 17.62 | 18.13 | 18.63 | 19.13 | 19.63 | 20.14 | 20.64 |
| Woodie | 10.91 | 13.96 | 16.39 | 19.44 | 21.87 | 24.92 | 27.35 |
| Fibonacci | 14.06 | 16.16 | 17.45 | 19.54 | 21.64 | 22.93 | 25.02 |
Numerical data
The following is the status of the technical indicators and moving averages at the time of publication of this technical analysis:
| RSI (14): | 38.16 | |
| MACD (12,26,9): | -0.6100 | |
| Directional Movement: | -12.24 | |
| AROON (14): | -92.86 | |
| DEMA (21): | 18.62 | |
| Parabolic SAR (0,02-0,02-0,2): | 20.50 | |
| Elder Ray (13): | -1.34 | |
| Super Trend (3,10): | 21.09 | |
| Zig ZAG (10): | 17.80 | |
| VORTEX (21): | 0.9800 | |
| Stochastique (14,3,5): | 10.82 | |
| TEMA (21): | 19.07 | |
| Williams %R (14): | -93.06 | |
| Chande Momentum Oscillator (20): | -4.11 | |
| Repulse (5,40,3): | -4.9700 | |
| ROCnROLL: | 2 | |
| TRIX (15,9): | -0.2300 | |
| Courbe Coppock: | 18.00 |
| MA7: | 18.59 | |
| MA20: | 20.02 | |
| MA50: | 20.84 | |
| MA100: | 25.56 | |
| MAexp7: | 18.71 | |
| MAexp20: | 19.43 | |
| MAexp50: | 21.42 | |
| MAexp100: | 24.99 | |
| Price / MA7: | -4.25% | |
| Price / MA20: | -11.09% | |
| Price / MA50: | -14.59% | |
| Price / MA100: | -30.36% | |
| Price / MAexp7: | -4.86% | |
| Price / MAexp20: | -8.39% | |
| Price / MAexp50: | -16.90% | |
| Price / MAexp100: | -28.77% |
News
The latest news and videos published on FLUOR CORP. at the time of the analysis were as follows:
- Fluor Joint Venture Breaks Ground on Chicago Transit Authority’s Red and Purple Line Modernization Program
- Fluor Corporation to Hold Third Quarter Earnings Conference Call
- Fluor Corporation Lead Director Peter Fluor to Retire from Board in April 2020
- Fluor Corporation Announces Strategic Review Results
- Fluor to Host Strategic Review Webcast
About author

Online


Add a comment
Comments
0 comments on the analysis FLUOR CORP. - Daily