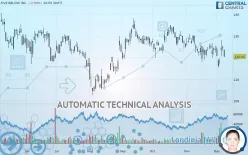
FIVE BELOW INC. - Daily - Technical analysis published on 12/10/2019 (GMT)
- 277
- 0
- Who voted?
Click here for a new analysis!
- Timeframe : Daily
- - Analysis generated on
- Status : INVALID

Summary of the analysis

Additional analysis
Quotes
FIVE BELOW INC. rating 120.55 USD. The price registered a decrease of -2.94% on the session with the lowest point at 120.22 USD and the highest point at 123.63 USD. The deviation from the price is +0.27% for the low point and -2.49% for the high point.The Central Gaps scanner detects a bearish opening. A small advantage for sellers in the very short term.
Bearish opening
Type : Bearish
Timeframe : Openning
Here is a more detailed summary of the historical variations registered by FIVE BELOW INC.:
Near a new LOW record (1 month)
Type : Bearish
Timeframe : Weekly
The Central Volumes scanner detects abnormal volumes on the asset:
Abnormal volumes
Timeframe : 5 days
Technical
Technical analysis of FIVE BELOW INC. in Daily shows a overall strongly bearish trend. 89.29% of the signals given by moving averages are bearish. This strongly bearish trend is supported by the strong bearish signals given by short-term moving averages. The Central Indicators scanner detects a bullish signal on moving averages that could impact this trend:
Bullish price crossover with adaptative moving average 20
Type : Bullish
Timeframe : Daily
An assessment of technical indicators does not currently provide any relevant information to suggest whether the signal given by the technical indicators is more bullish or bearish.
Other results related to technical indicators were also found by the Central Indicators scanner:
Pivot points : price is under support 3
Type : Neutral
Timeframe : Daily
MACD crosses UP its Moving Average
Type : Bullish
Timeframe : Daily
Momentum indicator is back over 0
Type : Bullish
Timeframe : Daily
The Central Patterns scanner, which studies chart patterns, resistances and supports, has identified this signal:
Horizontal support is broken
Type : Bearish
Timeframe : Daily
The Central Candlesticks scanner which studies Japanese candlesticks did not detect anything.
| S3 | S2 | S1 | Price | R1 | R2 | R3 | |
|---|---|---|---|---|---|---|---|
| ProTrendLines | 112.15 | 116.14 | 119.64 | 120.55 | 123.31 | 129.92 | 134.32 |
| Change (%) | -6.97% | -3.66% | -0.75% | - | +2.29% | +7.77% | +11.42% |
| Change | -8.40 | -4.41 | -0.91 | - | +2.76 | +9.37 | +13.77 |
| Level | Minor | Major | Major | - | Minor | Major | Major |
Attention could also be paid to pivot points to set price objectives:
| Pivot points | S3 | S2 | S1 | PP | R1 | R2 | R3 |
|---|---|---|---|---|---|---|---|
| Standard | 120.16 | 121.53 | 122.86 | 124.23 | 125.56 | 126.93 | 128.26 |
| Camarilla | 123.46 | 123.71 | 123.95 | 124.20 | 124.45 | 124.70 | 124.94 |
| Woodie | 120.15 | 121.52 | 122.85 | 124.22 | 125.55 | 126.92 | 128.25 |
| Fibonacci | 121.53 | 122.56 | 123.20 | 124.23 | 125.26 | 125.90 | 126.93 |
| Pivot points | S3 | S2 | S1 | PP | R1 | R2 | R3 |
|---|---|---|---|---|---|---|---|
| Standard | 104.19 | 109.76 | 116.98 | 122.55 | 129.77 | 135.34 | 142.56 |
| Camarilla | 120.68 | 121.86 | 123.03 | 124.20 | 125.37 | 126.54 | 127.72 |
| Woodie | 105.02 | 110.18 | 117.81 | 122.96 | 130.59 | 135.75 | 143.38 |
| Fibonacci | 109.76 | 114.65 | 117.66 | 122.55 | 127.43 | 130.45 | 135.34 |
| Pivot points | S3 | S2 | S1 | PP | R1 | R2 | R3 |
|---|---|---|---|---|---|---|---|
| Standard | 104.78 | 111.42 | 117.57 | 124.21 | 130.35 | 136.99 | 143.13 |
| Camarilla | 120.19 | 121.37 | 122.54 | 123.71 | 124.88 | 126.05 | 127.23 |
| Woodie | 104.53 | 111.30 | 117.32 | 124.08 | 130.10 | 136.87 | 142.89 |
| Fibonacci | 111.42 | 116.30 | 119.32 | 124.21 | 129.09 | 132.11 | 136.99 |
Numerical data
The following are the details of the technical indicators and moving averages that were collected to generate this technical analysis:
| RSI (14): | 44.83 | |
| MACD (12,26,9): | -1.3500 | |
| Directional Movement: | -4.47 | |
| AROON (14): | 14.28 | |
| DEMA (21): | 121.10 | |
| Parabolic SAR (0,02-0,02-0,2): | 115.84 | |
| Elder Ray (13): | -0.24 | |
| Super Trend (3,10): | 129.02 | |
| Zig ZAG (10): | 120.55 | |
| VORTEX (21): | 0.8600 | |
| Stochastique (14,3,5): | 58.47 | |
| TEMA (21): | 120.45 | |
| Williams %R (14): | -59.18 | |
| Chande Momentum Oscillator (20): | -3.03 | |
| Repulse (5,40,3): | -5.1400 | |
| ROCnROLL: | 2 | |
| TRIX (15,9): | -0.1700 | |
| Courbe Coppock: | 3.27 |
| MA7: | 120.98 | |
| MA20: | 122.52 | |
| MA50: | 125.80 | |
| MA100: | 122.96 | |
| MAexp7: | 121.63 | |
| MAexp20: | 122.88 | |
| MAexp50: | 124.37 | |
| MAexp100: | 124.48 | |
| Price / MA7: | -0.36% | |
| Price / MA20: | -1.61% | |
| Price / MA50: | -4.17% | |
| Price / MA100: | -1.96% | |
| Price / MAexp7: | -0.89% | |
| Price / MAexp20: | -1.90% | |
| Price / MAexp50: | -3.07% | |
| Price / MAexp100: | -3.16% |
News
The latest news and videos published on FIVE BELOW INC. at the time of the analysis were as follows:
-
 Jim Cramer on Millennial Investing, Five Below and the Trade War
-
Why Investors Should Pay Attention to Tariffs, FAANG, Five Below and Beyond Meat
- Option-trading opportunities on Citigroup, Five Below Inc., Micron, Lululemon, and Match Group
-
Amazon, Ulta And Five Below Among Holiday Retail Winners: Forrester Analyst | CNBC
- Thinking about buying stock or options on Bank of America, Five Below Inc., Kinder Morgan, NVIDIA or Sprint Corp?
About author

Online


Add a comment
Comments
0 comments on the analysis FIVE BELOW INC. - Daily