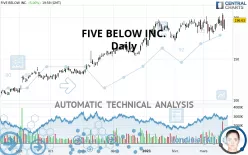
FIVE BELOW INC. - Daily - Technical analysis published on 03/22/2021 (GMT)
- 270
- 0
Click here for a new analysis!
- Timeframe : Daily
- - Analysis generated on
- Status : LEVEL MAINTAINED

Summary of the analysis

Additional analysis
Quotes
The FIVE BELOW INC. rating is 196.63 USD. On the day, this instrument gained +5.00% with the lowest point at 184.95 USD and the highest point at 198.10 USD. The deviation from the price is +6.32% for the low point and -0.74% for the high point.A bearish opening was detected by the Central Gaps scanner. Sellers are trying to impose a bearish trend in the very short term.
Bearish opening
Type : Bearish
Timeframe : Openning
A study of price movements over other periods shows the following variations:
New HIGH record (5 years)
Type : Bullish
Timeframe : Weekly
Near a new HIGH record (1 year)
Type : Bullish
Timeframe : Weekly
Near a new HIGH record (1st january)
Type : Bullish
Timeframe : Weekly
Near a new HIGH record (1 month)
Type : Bullish
Timeframe : Weekly
Technical
Technical analysis of this Daily chart of FIVE BELOW INC. indicates that the overall trend is strongly bullish. 92.86% of the signals given by moving averages are bullish. The overall trend is supported by the strong bullish signals from short-term moving averages. The Central Indicators scanner detects bearish signals on moving averages that could impact this trend:
Bearish price crossover with Moving Average 20
Type : Bearish
Timeframe : Daily
Bearish price crossover with Moving Average 50
Type : Bearish
Timeframe : Daily
In fact, 14 technical indicators on 18 studied are currently bullish. Caution: the Central Indicators scanner currently detects an excess:
CCI indicator: bearish divergence
Type : Bearish
Timeframe : Daily
CCI indicator: bullish divergence
Type : Bullish
Timeframe : Daily
RSI indicator: bearish divergence
Type : Bearish
Timeframe : Daily
Williams %R indicator is overbought : over -20
Type : Neutral
Timeframe : Daily
Pivot points : price is over resistance 1
Type : Neutral
Timeframe : Weekly
Pivot points : price is over resistance 3
Type : Neutral
Timeframe : Daily
Pivot points : price is under support 3
Type : Neutral
Timeframe : Daily
RSI indicator is back under 50
Type : Bearish
Timeframe : Daily
Aroon indicator bullish trend
Type : Bullish
Timeframe : Daily
Ichimoku - Bullish crossover : Tenkan & Kijun
Type : Bullish
Timeframe : Daily
Price is back under the pivot point
Type : Bearish
Timeframe : Weekly
Momentum indicator is back under 0
Type : Bearish
Timeframe : Daily
Williams %R indicator is back under -50
Type : Bearish
Timeframe : Daily
No signals are given by Central Patterns, a market scanner specialised in chart patterns, resistances and supports.
Central Candlesticks, the scanner specialised in Japanese candlesticks, detects a bearish signal that could support the hypothesis of a small drop in the very short term:
Bearish engulfing lines
Type : Bearish
Timeframe : Daily
| S3 | S2 | S1 | Price | |
|---|---|---|---|---|
| ProTrendLines | 156.22 | 172.69 | 194.53 | 196.63 |
| Change (%) | -20.55% | -12.18% | -1.07% | - |
| Change | -40.41 | -23.94 | -2.10 | - |
| Level | Minor | Intermediate | Major | - |
Pivot points can also be used to set your price objectives. Here is the price situation in relation to pivot points:
| Pivot points | S3 | S2 | S1 | PP | R1 | R2 | R3 |
|---|---|---|---|---|---|---|---|
| Standard | 175.20 | 180.08 | 188.35 | 193.23 | 201.50 | 206.38 | 214.65 |
| Camarilla | 193.01 | 194.22 | 195.43 | 196.63 | 197.84 | 199.04 | 200.25 |
| Woodie | 176.91 | 180.93 | 190.06 | 194.08 | 203.21 | 207.23 | 216.36 |
| Fibonacci | 180.08 | 185.10 | 188.20 | 193.23 | 198.25 | 201.35 | 206.38 |
| Pivot points | S3 | S2 | S1 | PP | R1 | R2 | R3 |
|---|---|---|---|---|---|---|---|
| Standard | 163.23 | 173.37 | 185.00 | 195.14 | 206.77 | 216.91 | 228.54 |
| Camarilla | 190.64 | 192.64 | 194.63 | 196.63 | 198.63 | 200.62 | 202.62 |
| Woodie | 163.98 | 173.74 | 185.75 | 195.51 | 207.52 | 217.28 | 229.29 |
| Fibonacci | 173.37 | 181.69 | 186.82 | 195.14 | 203.46 | 208.59 | 216.91 |
| Pivot points | S3 | S2 | S1 | PP | R1 | R2 | R3 |
|---|---|---|---|---|---|---|---|
| Standard | 144.98 | 158.00 | 172.06 | 185.08 | 199.14 | 212.16 | 226.22 |
| Camarilla | 178.67 | 181.16 | 183.64 | 186.12 | 188.60 | 191.09 | 193.57 |
| Woodie | 145.50 | 158.26 | 172.58 | 185.34 | 199.66 | 212.42 | 226.74 |
| Fibonacci | 158.00 | 168.35 | 174.74 | 185.08 | 195.43 | 201.82 | 212.16 |
Numerical data
The following are the details of the technical indicators and moving averages that were collected to generate this technical analysis:
| RSI (14): | 56.30 | |
| MACD (12,26,9): | 1.7700 | |
| Directional Movement: | 7.92 | |
| AROON (14): | 64.29 | |
| DEMA (21): | 192.85 | |
| Parabolic SAR (0,02-0,02-0,2): | 177.30 | |
| Elder Ray (13): | 0.17 | |
| Super Trend (3,10): | 177.97 | |
| Zig ZAG (10): | 196.63 | |
| VORTEX (21): | 0.9400 | |
| Stochastique (14,3,5): | 66.31 | |
| TEMA (21): | 192.15 | |
| Williams %R (14): | -26.61 | |
| Chande Momentum Oscillator (20): | 4.29 | |
| Repulse (5,40,3): | 1.3900 | |
| ROCnROLL: | 1 | |
| TRIX (15,9): | 0.0900 | |
| Courbe Coppock: | 2.17 |
| MA7: | 193.39 | |
| MA20: | 190.06 | |
| MA50: | 188.44 | |
| MA100: | 171.55 | |
| MAexp7: | 192.53 | |
| MAexp20: | 190.52 | |
| MAexp50: | 184.95 | |
| MAexp100: | 171.88 | |
| Price / MA7: | +1.68% | |
| Price / MA20: | +3.46% | |
| Price / MA50: | +4.35% | |
| Price / MA100: | +14.62% | |
| Price / MAexp7: | +2.13% | |
| Price / MAexp20: | +3.21% | |
| Price / MAexp50: | +6.32% | |
| Price / MAexp100: | +14.40% |
News
The latest news and videos published on FIVE BELOW INC. at the time of the analysis were as follows:
- Five Below Proudly Announces Opening Of 1000th Store
- (FIVE) Alert: Johnson Fistel Launches Investigation into Five Below, Inc.; Investors Suffering Losses Encouraged to Contact Firm
-
 Jim Cramer on Millennial Investing, Five Below and the Trade War
-
Why Investors Should Pay Attention to Tariffs, FAANG, Five Below and Beyond Meat
- Option-trading opportunities on Citigroup, Five Below Inc., Micron, Lululemon, and Match Group
About author

Online


Add a comment
Comments
0 comments on the analysis FIVE BELOW INC. - Daily