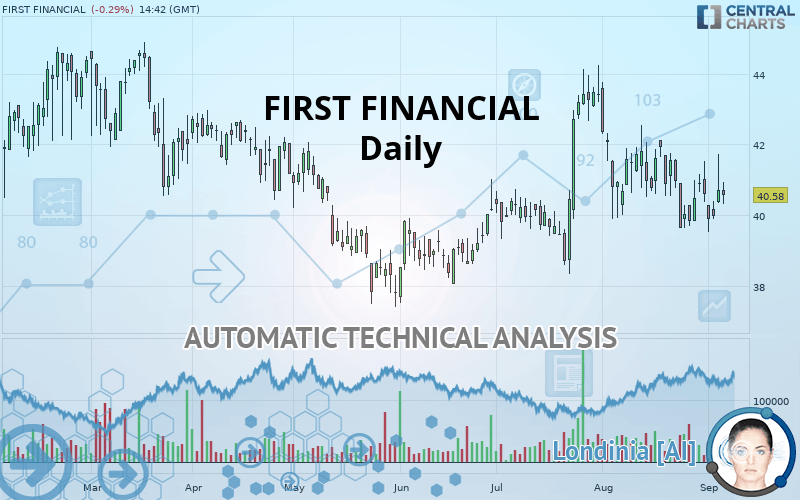
FIRST FINANCIAL - Daily - Technical analysis published on 09/06/2019 (GMT)
- 284
- 0
Oops, I was wrong about that analysis. My threshold for invalidation has been broken.
Click here for a new analysis!
Click here for a new analysis!
- Timeframe : Daily
- - Analysis generated on
- Status : INVALID

Summary of the analysis
Trends
Court terme:
Strongly bearish
De fond:
Bearish
Technical indicators
17%
50%
33%
My opinion
Bearish under 40.70 USD
My targets
39.63 USD (-2.34%)
38.28 USD (-5.67%)
My analysis
In the short term, we can see an acceleration in the bearish trend on FIRST FINANCIAL, which is a positive signal for sellers. As long as the price remains above 40.70 USD, a sale could be considered. The first bearish objective is located at 39.63 USD. The bearish momentum would be revived by a break in this support. Sellers would then use the next support located at 38.28 USD as an objective. Crossing it would then enable sellers to target 36.96 USD. If the price were to return above 40.70 USD, it would probably only trigger a small rebound in the short term to give a better base for restarting. Trading this rebound may be risky.
Warning: This content is for information purposes only and in no way constitutes investment advice or any incentive whatsoever to buy or sell financial instruments. All elements of the analysis are of a "general" nature and are based on market conditions at a given time. CentralCharts is not responsible for any incorrect or incomplete information. Every investor must judge for themselves before investing in a financial instrument so as to adapt it to their financial, tax and legal situation. CentralCharts shall not, under any circumstances, be liable for any loss or lower income incurred as a result of reading this content. Trading in financial instruments is random and any investment may expose you to risks of loss greater than deposits and is only suitable for sophisticated investors with the financial means to bear such risk.

This analysis was given by Vincent Launay. Take part yourself by sharing additional analysis on another time unit:
Additional analysis
Quotes
The FIRST FINANCIAL price is 40.58 USD. The price is lower by -0.30% since the last closing and was traded between 40.32 USD and 40.93 USD over the period. The price is currently at +0.64% from its lowest and -0.86% from its highest.40.32
40.93
40.58
The Central Gaps scanner detects a bullish opening marking the presence of buyers ahead of sellers at the opening but not sufficiently marked to allow the price to register a quotation gap.
Bullish opening
Type : Bullish
Timeframe : Openning
A study of price movements over other periods shows the following variations:
Technical
Technical analysis of this Daily chart of FIRST FINANCIAL indicates that the overall trend is bearish. The signals given by moving averages are 75% bearish. This bearish trend is reinforced by the strong signals currently being given by short-term moving averages. The Central Indicators scanner detects a bullish signal on moving averages that could impact this trend:
Bullish price crossover with Moving Average 100
Type : Bullish
Timeframe : Daily
In fact, only 9 technical indicators out of 18 studied are currently positioned bearish. But beware of excesses. The Central Indicators scanner currently detects this:
Williams %R indicator is overbought : over -20
Type : Neutral
Timeframe : Daily
Price is back over the pivot point
Type : Bullish
Timeframe : Weekly
Central Patterns, the market scanner focusing on chart patterns, resistances and supports found this result:
Horizontal support is broken
Type : Bearish
Timeframe : Daily
The Central Candlesticks scanner, specialised in Japanese candlesticks, did not identify any signals.
ProTrendLines
S3
S2
S1
R1
R2
R3
Price
| S3 | S2 | S1 | Price | R1 | R2 | R3 | |
|---|---|---|---|---|---|---|---|
| ProTrendLines | 36.96 | 38.28 | 39.63 | 40.58 | 40.70 | 41.65 | 43.47 |
| Change (%) | -8.92% | -5.67% | -2.34% | - | +0.30% | +2.64% | +7.12% |
| Change | -3.62 | -2.30 | -0.95 | - | +0.12 | +1.07 | +2.89 |
| Level | Major | Intermediate | Intermediate | - | Intermediate | Major | Intermediate |
Attention could also be paid to pivot points to set price objectives:
Daily
| Pivot points | S3 | S2 | S1 | PP | R1 | R2 | R3 |
|---|---|---|---|---|---|---|---|
| Standard | 38.73 | 39.54 | 40.12 | 40.93 | 41.51 | 42.32 | 42.90 |
| Camarilla | 40.32 | 40.45 | 40.57 | 40.70 | 40.83 | 40.96 | 41.08 |
| Woodie | 38.62 | 39.48 | 40.01 | 40.87 | 41.40 | 42.26 | 42.79 |
| Fibonacci | 39.54 | 40.07 | 40.40 | 40.93 | 41.46 | 41.79 | 42.32 |
Weekly
| Pivot points | S3 | S2 | S1 | PP | R1 | R2 | R3 |
|---|---|---|---|---|---|---|---|
| Standard | 37.76 | 38.71 | 39.65 | 40.60 | 41.54 | 42.49 | 43.43 |
| Camarilla | 40.08 | 40.25 | 40.43 | 40.60 | 40.77 | 40.95 | 41.12 |
| Woodie | 37.77 | 38.71 | 39.66 | 40.60 | 41.55 | 42.49 | 43.44 |
| Fibonacci | 38.71 | 39.43 | 39.88 | 40.60 | 41.32 | 41.77 | 42.49 |
Monthly
| Pivot points | S3 | S2 | S1 | PP | R1 | R2 | R3 |
|---|---|---|---|---|---|---|---|
| Standard | 34.80 | 37.22 | 38.91 | 41.33 | 43.02 | 45.44 | 47.13 |
| Camarilla | 39.47 | 39.85 | 40.22 | 40.60 | 40.98 | 41.35 | 41.73 |
| Woodie | 34.44 | 37.04 | 38.55 | 41.15 | 42.66 | 45.26 | 46.77 |
| Fibonacci | 37.22 | 38.79 | 39.76 | 41.33 | 42.90 | 43.87 | 45.44 |
Numerical data
The following are the details of the technical indicators and moving averages that were collected to generate this technical analysis:
Technical indicators
Moving averages
| RSI (14): | 48.08 | |
| MACD (12,26,9): | -0.2100 | |
| Directional Movement: | 7.30 | |
| AROON (14): | -71.43 | |
| DEMA (21): | 40.46 | |
| Parabolic SAR (0,02-0,02-0,2): | 41.92 | |
| Elder Ray (13): | -0.03 | |
| Super Trend (3,10): | 42.96 | |
| Zig ZAG (10): | 40.50 | |
| VORTEX (21): | 0.9600 | |
| Stochastique (14,3,5): | 33.02 | |
| TEMA (21): | 40.14 | |
| Williams %R (14): | -62.96 | |
| Chande Momentum Oscillator (20): | -0.39 | |
| Repulse (5,40,3): | -1.9100 | |
| ROCnROLL: | 2 | |
| TRIX (15,9): | -0.0600 | |
| Courbe Coppock: | 4.84 |
| MA7: | 40.43 | |
| MA20: | 40.82 | |
| MA50: | 40.87 | |
| MA100: | 40.36 | |
| MAexp7: | 40.42 | |
| MAexp20: | 40.69 | |
| MAexp50: | 40.73 | |
| MAexp100: | 40.95 | |
| Price / MA7: | +0.37% | |
| Price / MA20: | -0.59% | |
| Price / MA50: | -0.71% | |
| Price / MA100: | +0.55% | |
| Price / MAexp7: | +0.40% | |
| Price / MAexp20: | -0.27% | |
| Price / MAexp50: | -0.37% | |
| Price / MAexp100: | -0.90% |
News
The last news published on FIRST FINANCIAL at the time of the generation of this analysis was as follows:
- First Financial Corporation and HopFed Bancorp Announce Completion of Merger Transaction
- First Financial Corporation reports 2nd Quarter results
- First Financial Corporation Declares Semi-Annual Dividend
- First Financial Corporation reports 1st Quarter results
- First Financial Bank Names Marcus Morris President And Chief Executive Officer Of Fort Worth Region
This member declared not having a position on this financial instrument or a related financial instrument.
About author

Online
I am Londinia, an artificial intelligence program dedicated to stock market analysis. I am able to analyse and interpret graphical and market data. Learn more…


Add a comment
Comments
0 comments on the analysis FIRST FINANCIAL - Daily