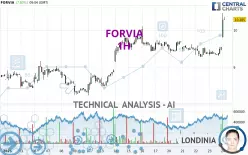
FORVIA - 1H - Technical analysis published on 01/24/2025 (GMT)
- 137
- 0
Click here for a new analysis!
- Timeframe : 1H
- - Analysis generated on
- Status : LEVEL MAINTAINED

Summary of the analysis

Additional analysis
Quotes
FORVIA rating 10.285 EUR. The price registered an increase of +7.83% on the session and was between 9.800 EUR and 10.460 EUR. This implies that the price is at +4.95% from its lowest and at -1.67% from its highest.The Central Gaps scanner detects the formation of a bullish gap marking the strong presence of buyers against sellers at the opening. This formed a quotation gap.
Opening Gap UP
Type : Bullish
Timeframe : Openning
So that you have an overall view of the price change, here is a table showing the variations over several periods:
New HIGH record (1st january)
Type : Bullish
Timeframe : Weekly
New HIGH record (1 month)
Type : Bullish
Timeframe : Weekly
Near a new HIGH record (1 month)
Type : Bullish
Timeframe : Weekly
Technical
Technical analysis of this 1H chart of FORVIA indicates that the overall trend is strongly bullish. 89.29% of the signals given by moving averages are bullish. This strongly bullish trend is supported by the strong bullish signals given by short-term moving averages. The Central Indicators market scanner is currently detecting a bullish signal that could impact this trend:
Bullish trend reversal : Moving Average 20
Type : Bullish
Timeframe : 1 hour
In fact, according to the parameters integrated into the Central Analyzer system, 17 technical indicators out of 18 analysed are currently bullish. Caution: the Central Indicators scanner currently detects an excess:
RSI indicator is overbought : over 80
Type : Neutral
Timeframe : 1 hour
CCI indicator is overbought : over 100
Type : Neutral
Timeframe : 1 hour
Williams %R indicator is overbought : over -20
Type : Neutral
Timeframe : 1 hour
Pivot points : price is over resistance 1
Type : Neutral
Timeframe : Weekly
Pivot points : price is over resistance 3
Type : Neutral
Timeframe : 1 hour
Ichimoku : price is over the cloud
Type : Bullish
Timeframe : 1 hour
SuperTrend indicator bullish reversal
Type : Bullish
Timeframe : 1 hour
MACD indicator is back over 0
Type : Bullish
Timeframe : 1 hour
Central Patterns, the market scanner focusing on chart patterns, resistances and supports found this result:
Near horizontal support
Type : Bullish
Timeframe : 1 hour
Central Candlesticks, the scanner specialised in Japanese candlesticks, detects a bullish signal that could support the hypothesis of a small rebound in the very short term:
Long white line
Type : Bullish
Timeframe : 1 hour
| S3 | S2 | S1 | Price | R1 | R2 | R3 | |
|---|---|---|---|---|---|---|---|
| ProTrendLines | 9.532 | 9.702 | 10.100 | 10.285 | 11.353 | 13.104 | 15.935 |
| Change (%) | -7.32% | -5.67% | -1.80% | - | +10.38% | +27.41% | +54.93% |
| Change | -0.753 | -0.583 | -0.185 | - | +1.068 | +2.819 | +5.650 |
| Level | Intermediate | Minor | Intermediate | - | Minor | Minor | Intermediate |
Pivot points can also be used to set your price objectives. Here is the price situation in relation to pivot points:
| Pivot points | S3 | S2 | S1 | PP | R1 | R2 | R3 |
|---|---|---|---|---|---|---|---|
| Standard | 9.119 | 9.207 | 9.373 | 9.461 | 9.627 | 9.715 | 9.881 |
| Camarilla | 9.468 | 9.491 | 9.515 | 9.538 | 9.561 | 9.585 | 9.608 |
| Woodie | 9.157 | 9.227 | 9.411 | 9.481 | 9.665 | 9.735 | 9.919 |
| Fibonacci | 9.207 | 9.304 | 9.364 | 9.461 | 9.558 | 9.618 | 9.715 |
| Pivot points | S3 | S2 | S1 | PP | R1 | R2 | R3 |
|---|---|---|---|---|---|---|---|
| Standard | 7.064 | 7.776 | 8.676 | 9.388 | 10.288 | 11.000 | 11.900 |
| Camarilla | 9.133 | 9.281 | 9.428 | 9.576 | 9.724 | 9.872 | 10.019 |
| Woodie | 7.158 | 7.823 | 8.770 | 9.435 | 10.382 | 11.047 | 11.994 |
| Fibonacci | 7.776 | 8.392 | 8.772 | 9.388 | 10.004 | 10.384 | 11.000 |
| Pivot points | S3 | S2 | S1 | PP | R1 | R2 | R3 |
|---|---|---|---|---|---|---|---|
| Standard | 5.631 | 6.539 | 7.609 | 8.517 | 9.587 | 10.495 | 11.565 |
| Camarilla | 8.136 | 8.317 | 8.499 | 8.680 | 8.861 | 9.043 | 9.224 |
| Woodie | 5.713 | 6.580 | 7.691 | 8.558 | 9.669 | 10.536 | 11.647 |
| Fibonacci | 6.539 | 7.294 | 7.761 | 8.517 | 9.272 | 9.739 | 10.495 |
Numerical data
The following is the status of technical indicators and moving averages registered at the time this technical analysis was created:
| RSI (14): | 81.23 | |
| MACD (12,26,9): | 0.0570 | |
| Directional Movement: | 47.097 | |
| AROON (14): | 100.000 | |
| DEMA (21): | 9.552 | |
| Parabolic SAR (0,02-0,02-0,2): | 9.306 | |
| Elder Ray (13): | 0.586 | |
| Super Trend (3,10): | 9.601 | |
| Zig ZAG (10): | 10.275 | |
| VORTEX (21): | 0.9980 | |
| Stochastique (14,3,5): | 87.22 | |
| TEMA (21): | 9.804 | |
| Williams %R (14): | -11.60 | |
| Chande Momentum Oscillator (20): | 0.973 | |
| Repulse (5,40,3): | 5.2300 | |
| ROCnROLL: | 1 | |
| TRIX (15,9): | -0.0030 | |
| Courbe Coppock: | 6.96 |
| MA7: | 9.631 | |
| MA20: | 9.121 | |
| MA50: | 8.689 | |
| MA100: | 8.642 | |
| MAexp7: | 9.811 | |
| MAexp20: | 9.514 | |
| MAexp50: | 9.467 | |
| MAexp100: | 9.329 | |
| Price / MA7: | +6.79% | |
| Price / MA20: | +12.76% | |
| Price / MA50: | +18.37% | |
| Price / MA100: | +19.01% | |
| Price / MAexp7: | +4.83% | |
| Price / MAexp20: | +8.10% | |
| Price / MAexp50: | +8.64% | |
| Price / MAexp100: | +10.25% |
News
Don't forget to follow the news on FORVIA. At the time of publication of this analysis, the latest news was as follows:
- FORVIA: Total number of voting rights and shares forming the share capital
- CANCEL AND REPLACE - AVAILABILITY OF THE FINANCIAL REPORT FOR THE FIRST HALF OF 2024
- H1 2024 RESULTS
- FORVIA: Share Buyback Transaction Statement From 06 May 2024 to 10 May 2024
- FORVIA: Total number of voting rights and shares forming the share capital
About author
Online


Add a comment
Comments
0 comments on the analysis FORVIA - 1H