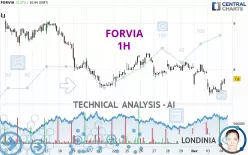
FORVIA - 1H - Technical analysis published on 12/04/2024 (GMT)
- 151
- 0
Click here for a new analysis!
- Timeframe : 1H
- - Analysis generated on
- Status : INVALID

Summary of the analysis

Additional analysis
Quotes
The FORVIA rating is 7.800 EUR. The price registered an increase of +3.37% on the session and was traded between 7.554 EUR and 7.800 EUR over the period. The price is currently at +3.26% from its lowest and 0% from its highest.So that you have an overall view of the price change, here is a table showing the variations over several periods:
Near a new LOW record (5 years)
Type : Bearish
Timeframe : Weekly
Near a new LOW record (1 year)
Type : Bearish
Timeframe : Weekly
Near a new LOW record (1st january)
Type : Bearish
Timeframe : Weekly
Near a new LOW record (1 month)
Type : Bearish
Timeframe : Weekly
Technical
A technical analysis in 1H of this FORVIA chart shows a bearish trend. 75.00% of the signals given by moving averages are bearish. Caution: as the signals currently given by short-term moving averages are rather neutral, the bearish trend could slow down. The Central Indicators market scanner is currently detecting several bullish signals that could impact this trend:
Bullish price crossover with Moving Average 20
Type : Bullish
Timeframe : 1 hour
Bullish price crossover with adaptative moving average 20
Type : Bullish
Timeframe : 1 hour
In fact, only 9 technical indicators out of 18 studied are currently bullish. Central Indicators, the detector scanner for these technical indicators has recently detected several signals:
Pivot points : price is over resistance 1
Type : Neutral
Timeframe : 1 hour
Pivot points : price is under support 1
Type : Neutral
Timeframe : Weekly
Central Patterns, the market scanner focusing on chart patterns, resistances and supports found these results:
Near horizontal resistance
Type : Bearish
Timeframe : 1 hour
Near support of channel
Type : Bullish
Timeframe : 1 hour
The Central Candlesticks scanner which studies Japanese candlesticks did not detect anything.
| S2 | S1 | Price | R1 | R2 | R3 | |
|---|---|---|---|---|---|---|
| ProTrendLines | 7.452 | 7.604 | 7.800 | 7.829 | 8.507 | 9.047 |
| Change (%) | -4.46% | -2.51% | - | +0.37% | +9.06% | +15.99% |
| Change | -0.348 | -0.196 | - | +0.029 | +0.707 | +1.247 |
| Level | Major | Minor | - | Minor | Intermediate | Intermediate |
Attention could also be paid to pivot points to set price objectives:
| Pivot points | S3 | S2 | S1 | PP | R1 | R2 | R3 |
|---|---|---|---|---|---|---|---|
| Standard | 7.054 | 7.250 | 7.398 | 7.594 | 7.742 | 7.938 | 8.086 |
| Camarilla | 7.451 | 7.483 | 7.515 | 7.546 | 7.578 | 7.609 | 7.641 |
| Woodie | 7.030 | 7.238 | 7.374 | 7.582 | 7.718 | 7.926 | 8.062 |
| Fibonacci | 7.250 | 7.381 | 7.463 | 7.594 | 7.725 | 7.807 | 7.938 |
| Pivot points | S3 | S2 | S1 | PP | R1 | R2 | R3 |
|---|---|---|---|---|---|---|---|
| Standard | 7.244 | 7.536 | 7.786 | 8.078 | 8.328 | 8.620 | 8.870 |
| Camarilla | 7.887 | 7.937 | 7.986 | 8.036 | 8.086 | 8.135 | 8.185 |
| Woodie | 7.223 | 7.526 | 7.765 | 8.068 | 8.307 | 8.610 | 8.849 |
| Fibonacci | 7.536 | 7.743 | 7.871 | 8.078 | 8.285 | 8.413 | 8.620 |
| Pivot points | S3 | S2 | S1 | PP | R1 | R2 | R3 |
|---|---|---|---|---|---|---|---|
| Standard | 5.731 | 6.665 | 7.351 | 8.285 | 8.971 | 9.905 | 10.591 |
| Camarilla | 7.591 | 7.739 | 7.888 | 8.036 | 8.185 | 8.333 | 8.482 |
| Woodie | 5.606 | 6.603 | 7.226 | 8.223 | 8.846 | 9.843 | 10.466 |
| Fibonacci | 6.665 | 7.284 | 7.667 | 8.285 | 8.904 | 9.287 | 9.905 |
Numerical data
The following is the status of the technical indicators and moving averages at the time of publication of this technical analysis:
| RSI (14): | 49.67 | |
| MACD (12,26,9): | -0.0900 | |
| Directional Movement: | -3.350 | |
| AROON (14): | -28.571 | |
| DEMA (21): | 7.611 | |
| Parabolic SAR (0,02-0,02-0,2): | 7.782 | |
| Elder Ray (13): | 0.051 | |
| Super Trend (3,10): | 7.842 | |
| Zig ZAG (10): | 7.784 | |
| VORTEX (21): | 0.9640 | |
| Stochastique (14,3,5): | 48.49 | |
| TEMA (21): | 7.580 | |
| Williams %R (14): | -37.36 | |
| Chande Momentum Oscillator (20): | -0.152 | |
| Repulse (5,40,3): | 1.9450 | |
| ROCnROLL: | -1 | |
| TRIX (15,9): | -0.1970 | |
| Courbe Coppock: | 7.66 |
| MA7: | 7.919 | |
| MA20: | 8.289 | |
| MA50: | 8.489 | |
| MA100: | 8.912 | |
| MAexp7: | 7.672 | |
| MAexp20: | 7.733 | |
| MAexp50: | 7.870 | |
| MAexp100: | 8.022 | |
| Price / MA7: | -1.50% | |
| Price / MA20: | -5.90% | |
| Price / MA50: | -8.12% | |
| Price / MA100: | -12.48% | |
| Price / MAexp7: | +1.67% | |
| Price / MAexp20: | +0.87% | |
| Price / MAexp50: | -0.89% | |
| Price / MAexp100: | -2.77% |
News
Don't forget to follow the news on FORVIA. At the time of publication of this analysis, the latest news was as follows:
- FORVIA: Total number of voting rights and shares forming the share capital
- CANCEL AND REPLACE - AVAILABILITY OF THE FINANCIAL REPORT FOR THE FIRST HALF OF 2024
- H1 2024 RESULTS
- FORVIA: Share Buyback Transaction Statement From 06 May 2024 to 10 May 2024
- FORVIA: Total number of voting rights and shares forming the share capital
About author
Online


Add a comment
Comments
0 comments on the analysis FORVIA - 1H