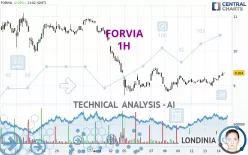
FORVIA - 1H - Technical analysis published on 08/14/2024 (GMT)
- 129
- 0
Click here for a new analysis!
- Timeframe : 1H
- - Analysis generated on
- Status : TARGET REACHED

Summary of the analysis

Additional analysis
Quotes
The FORVIA price is 9.364 EUR. The price registered an increase of +2.29% on the session and was between 9.144 EUR and 9.400 EUR. This implies that the price is at +2.41% from its lowest and at -0.38% from its highest.The Central Gaps scanner detects the formation of a bullish gap marking the strong presence of buyers against sellers at the opening. This formed a quotation gap.
Opening Gap UP
Type : Bullish
Timeframe : Openning
A study of price movements over other periods shows the following variations:
Near a new LOW record (5 years)
Type : Bearish
Timeframe : Weekly
Near a new LOW record (1 year)
Type : Bearish
Timeframe : Weekly
Near a new LOW record (1st january)
Type : Bearish
Timeframe : Weekly
Near a new LOW record (1 month)
Type : Bearish
Timeframe : Weekly
Technical
A technical analysis in 1H of this FORVIA chart shows a neutral trend. This indecision could turn into a bullish trend due to the strong bullish signals currently being given by short-term moving averages. There is no crossing of moving average by the price or crossing of moving averages between themselves.
In fact, according to the parameters integrated into the Central Analyzer system, 16 technical indicators out of 18 analysed are currently bullish. Caution: the Central Indicators scanner currently detects an excess:
CCI indicator is overbought : over 100
Type : Neutral
Timeframe : 1 hour
Williams %R indicator is overbought : over -20
Type : Neutral
Timeframe : 1 hour
Pivot points : price is over resistance 1
Type : Neutral
Timeframe : 1 hour
Central Patterns, the market scanner focusing on chart patterns, resistances and supports found this result:
Resistance of channel is broken
Type : Bullish
Timeframe : 1 hour
For a small rebound in the very short term, the Central Candlesticks scanner currently notes the presence of this bullish pattern in Japanese candlesticks:
Bullish engulfing lines
Type : Bullish
Timeframe : 1 hour
| S2 | S1 | Price | R1 | R2 | R3 | |
|---|---|---|---|---|---|---|
| ProTrendLines | 8.822 | 9.219 | 9.364 | 9.962 | 10.635 | 11.198 |
| Change (%) | -5.79% | -1.55% | - | +6.39% | +13.57% | +19.59% |
| Change | -0.542 | -0.145 | - | +0.598 | +1.271 | +1.834 |
| Level | Intermediate | Major | - | Minor | Minor | Intermediate |
Attention could also be paid to pivot points to set price objectives:
| Pivot points | S3 | S2 | S1 | PP | R1 | R2 | R3 |
|---|---|---|---|---|---|---|---|
| Standard | 8.742 | 8.858 | 9.006 | 9.122 | 9.270 | 9.386 | 9.534 |
| Camarilla | 9.081 | 9.106 | 9.130 | 9.154 | 9.178 | 9.202 | 9.227 |
| Woodie | 8.758 | 8.866 | 9.022 | 9.130 | 9.286 | 9.394 | 9.550 |
| Fibonacci | 8.858 | 8.959 | 9.021 | 9.122 | 9.223 | 9.285 | 9.386 |
| Pivot points | S3 | S2 | S1 | PP | R1 | R2 | R3 |
|---|---|---|---|---|---|---|---|
| Standard | 7.927 | 8.323 | 8.739 | 9.135 | 9.551 | 9.947 | 10.363 |
| Camarilla | 8.931 | 9.005 | 9.080 | 9.154 | 9.228 | 9.303 | 9.377 |
| Woodie | 7.936 | 8.328 | 8.748 | 9.140 | 9.560 | 9.952 | 10.372 |
| Fibonacci | 8.323 | 8.634 | 8.825 | 9.135 | 9.446 | 9.637 | 9.947 |
| Pivot points | S3 | S2 | S1 | PP | R1 | R2 | R3 |
|---|---|---|---|---|---|---|---|
| Standard | 7.933 | 8.948 | 9.891 | 10.906 | 11.849 | 12.864 | 13.807 |
| Camarilla | 10.297 | 10.476 | 10.656 | 10.835 | 11.015 | 11.194 | 11.374 |
| Woodie | 7.898 | 8.930 | 9.856 | 10.888 | 11.814 | 12.846 | 13.772 |
| Fibonacci | 8.948 | 9.696 | 10.158 | 10.906 | 11.654 | 12.116 | 12.864 |
Numerical data
The following are the details of the technical indicators and moving averages that were collected to generate this technical analysis:
| RSI (14): | 64.82 | |
| MACD (12,26,9): | 0.0430 | |
| Directional Movement: | 19.435 | |
| AROON (14): | 50.000 | |
| DEMA (21): | 9.230 | |
| Parabolic SAR (0,02-0,02-0,2): | 9.029 | |
| Elder Ray (13): | 0.131 | |
| Super Trend (3,10): | 9.075 | |
| Zig ZAG (10): | 9.376 | |
| VORTEX (21): | 1.1020 | |
| Stochastique (14,3,5): | 92.19 | |
| TEMA (21): | 9.291 | |
| Williams %R (14): | -5.63 | |
| Chande Momentum Oscillator (20): | 0.214 | |
| Repulse (5,40,3): | 1.3570 | |
| ROCnROLL: | 1 | |
| TRIX (15,9): | 0.0250 | |
| Courbe Coppock: | 2.75 |
| MA7: | 9.133 | |
| MA20: | 9.960 | |
| MA50: | 11.064 | |
| MA100: | 12.680 | |
| MAexp7: | 9.258 | |
| MAexp20: | 9.186 | |
| MAexp50: | 9.228 | |
| MAexp100: | 9.498 | |
| Price / MA7: | +2.53% | |
| Price / MA20: | -5.98% | |
| Price / MA50: | -15.37% | |
| Price / MA100: | -26.15% | |
| Price / MAexp7: | +1.14% | |
| Price / MAexp20: | +1.94% | |
| Price / MAexp50: | +1.47% | |
| Price / MAexp100: | -1.41% |
News
The last news published on FORVIA at the time of the generation of this analysis was as follows:
- CANCEL AND REPLACE - AVAILABILITY OF THE FINANCIAL REPORT FOR THE FIRST HALF OF 2024
- H1 2024 RESULTS
- FORVIA: Share Buyback Transaction Statement From 06 May 2024 to 10 May 2024
- FORVIA: Total number of voting rights and shares forming the share capital
- FORVIA: Share Buyback Transaction Statement from 29 April 2024 to 03 May 2024
About author
Online


Add a comment
Comments
0 comments on the analysis FORVIA - 1H