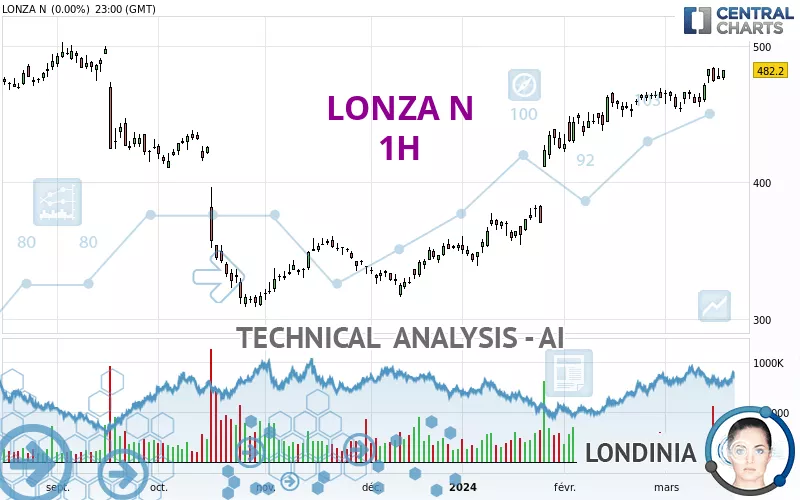
LONZA N - 1H - Technical analysis published on 03/20/2024 (GMT)
- 150
- 0
Click here for a new analysis!
- Timeframe : 1H
- - Analysis generated on
- Status : TARGET REACHED

Summary of the analysis

Additional analysis
Quotes
The LONZA N price is 514.6 CHF. The price has increased by +6.72% since the last closing and was between 498.4 CHF and 515.4 CHF. This implies that the price is at +3.25% from its lowest and at -0.16% from its highest.The Central Gaps scanner detects the formation of a bullish gap marking the strong presence of buyers against sellers at the opening. This formed a quotation gap.
Opening Gap UP
Type : Bullish
Timeframe : Openning
Here is a more detailed summary of the historical variations registered by LONZA N:
New HIGH record (1st january)
Type : Bullish
Timeframe : Weekly
New HIGH record (1 month)
Type : Bullish
Timeframe : Weekly
Technical
Technical analysis of LONZA N in 1H shows a strongly overall bullish trend. The signals given by the moving averages are 92.86% bullish. This strong bullish trend is confirmed by the strong signals currently being given by short-term moving averages. The Central Indicators market scanner currently does not detect any result that concerns moving averages.
In fact, 16 technical indicators on 18 studied are currently bullish. But beware of excesses. The Central Indicators scanner currently detects this:
RSI indicator is overbought : over 80
Type : Neutral
Timeframe : 1 hour
CCI indicator is overbought : over 100
Type : Neutral
Timeframe : 1 hour
Previous candle closed over Bollinger bands
Type : Neutral
Timeframe : 1 hour
Williams %R indicator is overbought : over -20
Type : Neutral
Timeframe : 1 hour
Pivot points : price is over resistance 2
Type : Neutral
Timeframe : Weekly
Pivot points : price is over resistance 3
Type : Neutral
Timeframe : 1 hour
An analysis of the price chart with the Central Patterns scanner (detector of chart patterns and resistances and supports) shows several results that can have an impact on the price change:
Near horizontal resistance
Type : Bearish
Timeframe : 1 hour
Resistance of channel is broken
Type : Bullish
Timeframe : 1 hour
The Central Candlesticks scanner, specialised in Japanese candlesticks, did not identify any signals.
| S3 | S2 | S1 | Price | R1 | R2 | R3 | |
|---|---|---|---|---|---|---|---|
| ProTrendLines | 481.4 | 484.8 | 497.3 | 514.6 | 528.4 | 553.2 | 597.8 |
| Change (%) | -6.45% | -5.79% | -3.36% | - | +2.68% | +7.50% | +16.17% |
| Change | -33.2 | -29.8 | -17.3 | - | +13.8 | +38.6 | +83.2 |
| Level | Minor | Intermediate | Intermediate | - | Intermediate | Minor | Intermediate |
Attention could also be paid to pivot points to set price objectives:
| Pivot points | S3 | S2 | S1 | PP | R1 | R2 | R3 |
|---|---|---|---|---|---|---|---|
| Standard | 469.5 | 472.1 | 477.1 | 479.7 | 484.7 | 487.3 | 492.3 |
| Camarilla | 480.1 | 480.8 | 481.5 | 482.2 | 482.9 | 483.6 | 484.3 |
| Woodie | 470.8 | 472.7 | 478.4 | 480.3 | 486.0 | 487.9 | 493.6 |
| Fibonacci | 472.1 | 475.0 | 476.8 | 479.7 | 482.6 | 484.4 | 487.3 |
| Pivot points | S3 | S2 | S1 | PP | R1 | R2 | R3 |
|---|---|---|---|---|---|---|---|
| Standard | 427.8 | 441.3 | 457.7 | 471.2 | 487.6 | 501.1 | 517.5 |
| Camarilla | 465.8 | 468.5 | 471.3 | 474.0 | 476.7 | 479.5 | 482.2 |
| Woodie | 429.2 | 442.0 | 459.1 | 471.9 | 489.0 | 501.8 | 518.9 |
| Fibonacci | 441.3 | 452.8 | 459.8 | 471.2 | 482.7 | 489.7 | 501.1 |
| Pivot points | S3 | S2 | S1 | PP | R1 | R2 | R3 |
|---|---|---|---|---|---|---|---|
| Standard | 386.8 | 404.6 | 433.3 | 451.1 | 479.8 | 497.6 | 526.3 |
| Camarilla | 449.2 | 453.5 | 457.7 | 462.0 | 466.3 | 470.5 | 474.8 |
| Woodie | 392.3 | 407.3 | 438.8 | 453.8 | 485.3 | 500.3 | 531.8 |
| Fibonacci | 404.6 | 422.4 | 433.3 | 451.1 | 468.9 | 479.8 | 497.6 |
Numerical data
The following is the status of technical indicators and moving averages registered at the time this technical analysis was created:
| RSI (14): | 86.00 | |
| MACD (12,26,9): | 7.6000 | |
| Directional Movement: | 46.8 | |
| AROON (14): | 78.6 | |
| DEMA (21): | 496.5 | |
| Parabolic SAR (0,02-0,02-0,2): | 481.1 | |
| Elder Ray (13): | 18.1 | |
| Super Trend (3,10): | 495.2 | |
| Zig ZAG (10): | 513.2 | |
| VORTEX (21): | 1.2000 | |
| Stochastique (14,3,5): | 98.40 | |
| TEMA (21): | 501.6 | |
| Williams %R (14): | 0.00 | |
| Chande Momentum Oscillator (20): | 37.9 | |
| Repulse (5,40,3): | 3.1000 | |
| ROCnROLL: | 1 | |
| TRIX (15,9): | 0.1000 | |
| Courbe Coppock: | 8.20 |
| MA7: | 480.2 | |
| MA20: | 468.1 | |
| MA50: | 436.9 | |
| MA100: | 388.5 | |
| MAexp7: | 499.8 | |
| MAexp20: | 487.9 | |
| MAexp50: | 479.4 | |
| MAexp100: | 472.8 | |
| Price / MA7: | +7.16% | |
| Price / MA20: | +9.93% | |
| Price / MA50: | +17.78% | |
| Price / MA100: | +32.46% | |
| Price / MAexp7: | +2.96% | |
| Price / MAexp20: | +5.47% | |
| Price / MAexp50: | +7.34% | |
| Price / MAexp100: | +8.84% |
News
Don't forget to follow the news on LONZA N. At the time of publication of this analysis, the latest news was as follows:
- Lonza Signs Agreement to Acquire Large-Scale Biologics Site in Vacaville (US) from Roche
- Jean-Marc Huët to succeed Albert M. Baehny as Chairman of Lonza
- Lonza Delivers Solid 2023 Performance with 10.9% CER Sales Growth and 29.8% CORE EBITDA Margin
- Lonza Prices CHF 400 Million Dual-Tranche Straight Bonds
- Capital Markets Day 2023: New Mid-Term Guidance 2024 – 2028 Supported by Ramp-Up of Growth Projects
About author
Online


Add a comment
Comments
0 comments on the analysis LONZA N - 1H