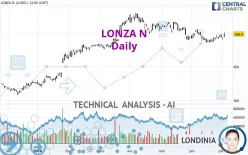
LONZA N - Daily - Technical analysis published on 07/04/2024 (GMT)
- 149
- 0
Click here for a new analysis!
- Timeframe : Daily
- - Analysis generated on
- Status : TARGET REACHED

Summary of the analysis

Additional analysis
Quotes
The LONZA N price is 503.4 CHF. The price registered an increase of +1.31% on the session and was traded between 496.5 CHF and 503.4 CHF over the period. The price is currently at +1.39% from its lowest and 0% from its highest.A study of price movements over other periods shows the following variations:
Near a new HIGH record (1 month)
Type : Bullish
Timeframe : Weekly
Technical
Technical analysis of this Daily chart of LONZA N indicates that the overall trend is bullish. The signals given by moving averages are 71.43% bullish. This bullish trend is slowing down slightly given the slightly bullish signals of short-term moving averages. The Central Indicators market scanner is currently detecting several bullish signals that could impact this trend:
Bullish trend reversal : adaptative moving average 50
Type : Bullish
Timeframe : Daily
Bullish price crossover with Moving Average 50
Type : Bullish
Timeframe : Daily
Bullish price crossover with adaptative moving average 20
Type : Bullish
Timeframe : Daily
Bullish price crossover with adaptative moving average 100
Type : Bullish
Timeframe : Daily
In fact, 14 technical indicators on 18 studied are currently bullish. Caution: the Central Indicators scanner currently detects an excess:
CCI indicator is overbought : over 100
Type : Neutral
Timeframe : Daily
Williams %R indicator is overbought : over -20
Type : Neutral
Timeframe : Daily
Pivot points : price is over resistance 1
Type : Neutral
Timeframe : Weekly
An analysis of the price chart with the Central Patterns scanner (detector of chart patterns and resistances and supports) shows several results that can have an impact on the price change:
Near horizontal resistance
Type : Bearish
Timeframe : Daily
Resistance of channel is broken
Type : Bullish
Timeframe : Daily
The Central Candlesticks scanner which studies Japanese candlesticks did not detect anything.
| S3 | S2 | S1 | Price | R1 | R2 | R3 | |
|---|---|---|---|---|---|---|---|
| ProTrendLines | 357.2 | 437.5 | 487.6 | 503.4 | 507.2 | 528.4 | 557.8 |
| Change (%) | -29.04% | -13.09% | -3.14% | - | +0.75% | +4.97% | +10.81% |
| Change | -146.2 | -65.9 | -15.8 | - | +3.8 | +25.0 | +54.4 |
| Level | Intermediate | Major | Major | - | Intermediate | Major | Intermediate |
To determine price objectives, it is also possible to use the pivot points. Here is the price position in relation to pivot points:
| Pivot points | S3 | S2 | S1 | PP | R1 | R2 | R3 |
|---|---|---|---|---|---|---|---|
| Standard | 471.7 | 479.6 | 488.3 | 496.2 | 504.9 | 512.8 | 521.5 |
| Camarilla | 492.3 | 493.9 | 495.4 | 496.9 | 498.4 | 499.9 | 501.5 |
| Woodie | 472.0 | 479.8 | 488.6 | 496.4 | 505.2 | 513.0 | 521.8 |
| Fibonacci | 479.6 | 486.0 | 489.9 | 496.2 | 502.6 | 506.5 | 512.8 |
| Pivot points | S3 | S2 | S1 | PP | R1 | R2 | R3 |
|---|---|---|---|---|---|---|---|
| Standard | 456.8 | 465.2 | 477.8 | 486.2 | 498.8 | 507.2 | 519.8 |
| Camarilla | 484.6 | 486.6 | 488.5 | 490.4 | 492.3 | 494.3 | 496.2 |
| Woodie | 458.9 | 466.3 | 479.9 | 487.3 | 500.9 | 508.3 | 521.9 |
| Fibonacci | 465.2 | 473.2 | 478.2 | 486.2 | 494.2 | 499.2 | 507.2 |
| Pivot points | S3 | S2 | S1 | PP | R1 | R2 | R3 |
|---|---|---|---|---|---|---|---|
| Standard | 429.7 | 450.4 | 470.4 | 491.1 | 511.1 | 531.8 | 551.8 |
| Camarilla | 479.2 | 482.9 | 486.7 | 490.4 | 494.1 | 497.9 | 501.6 |
| Woodie | 429.4 | 450.2 | 470.1 | 490.9 | 510.8 | 531.6 | 551.5 |
| Fibonacci | 450.4 | 466.0 | 475.6 | 491.1 | 506.7 | 516.3 | 531.8 |
Numerical data
The following is the status of the technical indicators and moving averages at the time of publication of this technical analysis:
| RSI (14): | 57.40 | |
| MACD (12,26,9): | -1.6000 | |
| Directional Movement: | 6.7 | |
| AROON (14): | 85.8 | |
| DEMA (21): | 486.3 | |
| Parabolic SAR (0,02-0,02-0,2): | 478.6 | |
| Elder Ray (13): | 10.0 | |
| Super Trend (3,10): | 510.9 | |
| Zig ZAG (10): | 501.8 | |
| VORTEX (21): | 1.0000 | |
| Stochastique (14,3,5): | 76.30 | |
| TEMA (21): | 489.6 | |
| Williams %R (14): | -6.60 | |
| Chande Momentum Oscillator (20): | 25.0 | |
| Repulse (5,40,3): | 2.1000 | |
| ROCnROLL: | 1 | |
| TRIX (15,9): | -0.2000 | |
| Courbe Coppock: | 2.40 |
| MA7: | 491.0 | |
| MA20: | 486.6 | |
| MA50: | 501.7 | |
| MA100: | 497.0 | |
| MAexp7: | 492.2 | |
| MAexp20: | 490.2 | |
| MAexp50: | 494.3 | |
| MAexp100: | 485.1 | |
| Price / MA7: | +2.53% | |
| Price / MA20: | +3.45% | |
| Price / MA50: | +0.34% | |
| Price / MA100: | +1.29% | |
| Price / MAexp7: | +2.28% | |
| Price / MAexp20: | +2.69% | |
| Price / MAexp50: | +1.84% | |
| Price / MAexp100: | +3.77% |
News
The last news published on LONZA N at the time of the generation of this analysis was as follows:
- Lonza Welcomes New Group Chief Executive Officer Wolfgang Wienand
- Q1 2024 Qualitative Update: Performance In Line with Expectations for Full-Year 2024
- Lonza Announces Results of the 2024 Annual General Meeting – All Motions Proposed by Board of Directors Approved
- Lonza Prices EUR 1 Billion Straight Bond with a 3.875% Coupon
- NeuroSense Collaborates with Lonza to Identify Exosome-based Biomarkers, in order to Advance Neurodegenerative Disease Treatments and Diagnostics
About author
Online


Add a comment
Comments
0 comments on the analysis LONZA N - Daily