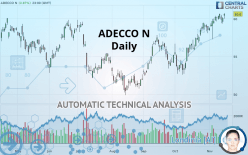
ADECCO N - Daily - Technical analysis published on 11/18/2019 (GMT)
- Who voted?
- 253
- 0
Click here for a new analysis!
- Timeframe : Daily
- - Analysis generated on
- Status : LEVEL MAINTAINED

Summary of the analysis

Additional analysis
Quotes
The ADECCO N rating is 60.60 CHF. The price has increased by +0.87% since the last closing and was traded between 60.00 CHF and 60.74 CHF over the period. The price is currently at +1.00% from its lowest and -0.23% from its highest.The Central Gaps scanner detects a bearish opening marking the presence of sellers ahead of buyers at the opening but not sufficiently marked to allow the price to register a quotation gap.
Bearish opening
Type : Bearish
Timeframe : Openning
A study of price movements over other periods shows the following variations:
Near a new HIGH record (1 year)
Type : Bullish
Timeframe : Weekly
Near a new HIGH record (1st january)
Type : Bullish
Timeframe : Weekly
Near a new HIGH record (1 month)
Type : Bullish
Timeframe : Weekly
Technical
Technical analysis of this Daily chart of ADECCO N indicates that the overall trend is strongly bullish. 92.86% of the signals given by moving averages are bullish. This strongly bullish trend is supported by the strong bullish signals given by short-term moving averages. The Central Indicators scanner does not detect any result on moving averages that would impact this trend.
In fact, only 9 technical indicators out of 18 studied are currently positioned bullish. But beware of excesses. The Central Indicators scanner currently detects this:
RSI indicator is overbought : over 70
Type : Neutral
Timeframe : Daily
CCI indicator is overbought : over 100
Type : Neutral
Timeframe : Daily
Williams %R indicator is overbought : over -20
Type : Neutral
Timeframe : Daily
Pivot points : price is over resistance 2
Type : Neutral
Timeframe : Weekly
Pivot points : price is under support 1
Type : Neutral
Timeframe : Daily
Price is back over the pivot point
Type : Bullish
Timeframe : Daily
An analysis of the price chart with the Central Patterns scanner (detector of chart patterns and resistances and supports) shows several results that can have an impact on the price change:
Near resistance of channel
Type : Bearish
Timeframe : Daily
Horizontal resistance is broken
Type : Bullish
Timeframe : Daily
No result was found by the Central Candlesticks scanner on Japanese candlesticks.
| S3 | S2 | S1 | Price | R1 | R2 | R3 | |
|---|---|---|---|---|---|---|---|
| ProTrendLines | 55.68 | 57.50 | 60.06 | 60.60 | 66.04 | 72.97 | 79.58 |
| Change (%) | -8.12% | -5.12% | -0.89% | - | +8.98% | +20.41% | +31.32% |
| Change | -4.92 | -3.10 | -0.54 | - | +5.44 | +12.37 | +18.98 |
| Level | Intermediate | Minor | Major | - | Major | Minor | Intermediate |
Attention could also be paid to pivot points to set price objectives:
| Pivot points | S3 | S2 | S1 | PP | R1 | R2 | R3 |
|---|---|---|---|---|---|---|---|
| Standard | 59.45 | 59.71 | 60.15 | 60.41 | 60.85 | 61.11 | 61.55 |
| Camarilla | 60.41 | 60.47 | 60.54 | 60.60 | 60.66 | 60.73 | 60.79 |
| Woodie | 59.55 | 59.76 | 60.25 | 60.46 | 60.95 | 61.16 | 61.65 |
| Fibonacci | 59.71 | 59.97 | 60.14 | 60.41 | 60.67 | 60.84 | 61.11 |
| Pivot points | S3 | S2 | S1 | PP | R1 | R2 | R3 |
|---|---|---|---|---|---|---|---|
| Standard | 56.64 | 57.36 | 58.04 | 58.76 | 59.44 | 60.16 | 60.84 |
| Camarilla | 58.34 | 58.46 | 58.59 | 58.72 | 58.85 | 58.98 | 59.11 |
| Woodie | 56.62 | 57.35 | 58.02 | 58.75 | 59.42 | 60.15 | 60.82 |
| Fibonacci | 57.36 | 57.90 | 58.23 | 58.76 | 59.30 | 59.63 | 60.16 |
| Pivot points | S3 | S2 | S1 | PP | R1 | R2 | R3 |
|---|---|---|---|---|---|---|---|
| Standard | 47.35 | 49.97 | 54.23 | 56.85 | 61.11 | 63.73 | 67.99 |
| Camarilla | 56.59 | 57.22 | 57.85 | 58.48 | 59.11 | 59.74 | 60.37 |
| Woodie | 48.16 | 50.38 | 55.04 | 57.26 | 61.92 | 64.14 | 68.80 |
| Fibonacci | 49.97 | 52.60 | 54.23 | 56.85 | 59.48 | 61.11 | 63.73 |
Numerical data
The following is the status of the technical indicators and moving averages at the time of publication of this technical analysis:
| RSI (14): | 64.53 | |
| MACD (12,26,9): | 1.2000 | |
| Directional Movement: | 2.50 | |
| AROON (14): | 35.72 | |
| DEMA (21): | 60.39 | |
| Parabolic SAR (0,02-0,02-0,2): | 57.90 | |
| Elder Ray (13): | 0.50 | |
| Super Trend (3,10): | 57.54 | |
| Zig ZAG (10): | 59.88 | |
| VORTEX (21): | 1.1600 | |
| Stochastique (14,3,5): | 91.07 | |
| TEMA (21): | 60.76 | |
| Williams %R (14): | -22.81 | |
| Chande Momentum Oscillator (20): | 0.46 | |
| Repulse (5,40,3): | 1.3100 | |
| ROCnROLL: | 1 | |
| TRIX (15,9): | 0.3100 | |
| Courbe Coppock: | 7.89 |
| MA7: | 60.08 | |
| MA20: | 58.83 | |
| MA50: | 56.66 | |
| MA100: | 55.20 | |
| MAexp7: | 59.96 | |
| MAexp20: | 58.81 | |
| MAexp50: | 57.05 | |
| MAexp100: | 55.93 | |
| Price / MA7: | +0.87% | |
| Price / MA20: | +3.01% | |
| Price / MA50: | +6.95% | |
| Price / MA100: | +9.78% | |
| Price / MAexp7: | +1.07% | |
| Price / MAexp20: | +3.04% | |
| Price / MAexp50: | +6.22% | |
| Price / MAexp100: | +8.35% |
News
The last news published on ADECCO N at the time of the generation of this analysis was as follows:
- Financial Organisations Prioritising Investment in Technology Over Upskilling, Reveals Adecco
- Adecco Research Reveals Businesses Are Prioritising Investment in Technology Over Upskilling
- The Adecco Group: New Research Shows a Widening Gap Between Small and Large Businesses Ahead of Brexit
- The Adecco Group Names its 2019 'CEO for One Month' in the U.S.
- Adecco Group/CIPD: Employment Growth Set to Continue but Pay Intentions Remain Subdued for Most Workers Apart From New Hires and Key Staff, New Research Suggests
About author

Online


Add a comment
Comments
0 comments on the analysis ADECCO N - Daily