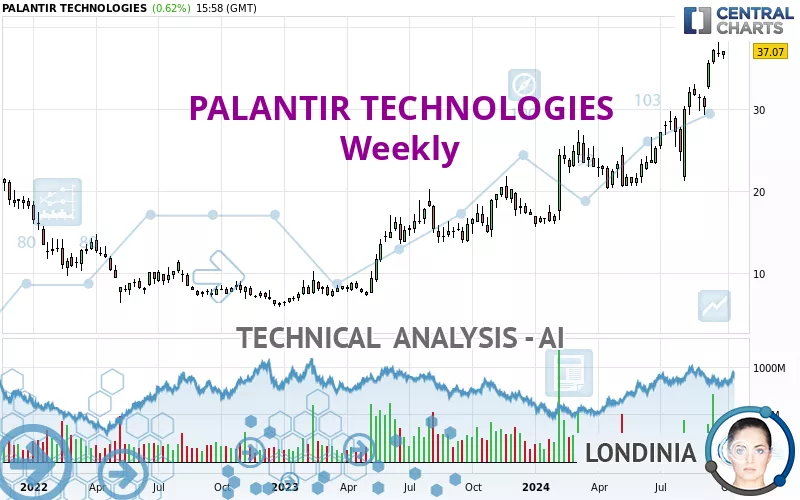
PALANTIR TECHNOLOGIES - Weekly - Technical analysis published on 09/30/2024 (GMT)
- 178
- 0
- Timeframe : Weekly
- - Analysis generated on
- Status : CANCELLED

Summary of the analysis

Additional analysis
Quotes
The PALANTIR TECHNOLOGIES rating is 37.07 USD. The price is lower by -2.32% over the 5 days and has been traded over the last 5 days between 36.15 USD and 37.47 USD. This implies that the 5 day price is +2.54% from its lowest point and -1.07% from its highest point.The Central Gaps scanner detects the formation of a bearish gap marking the strong presence of sellers ahead of buyers at the opening. This formed a quotation gap.
Opening Gap DOWN
Type : Bearish
Timeframe : Openning
A study of price movements over other periods shows the following variations:
Near a new HIGH record (1 year)
Type : Bullish
Timeframe : Weekly
Near a new HIGH record (1st january)
Type : Bullish
Timeframe : Weekly
Near a new HIGH record (1 month)
Type : Bullish
Timeframe : Weekly
Technical
A technical analysis in Weekly of this PALANTIR TECHNOLOGIES chart shows a strongly bullish trend. The signals given by the moving averages are 92.86% bullish. This strong bullish trend is confirmed by the strong signals currently being given by short-term moving averages. The Central Indicators market scanner currently does not detect any result that concerns moving averages.
Technical indicators are strongly bullish, suggesting that the price increase should continue.
But beware of excesses. The Central Indicators scanner currently detects this:
RSI indicator is overbought : over 70
Type : Neutral
Timeframe : Weekly
CCI indicator is overbought : over 100
Type : Neutral
Timeframe : Weekly
Williams %R indicator is overbought : over -20
Type : Neutral
Timeframe : Weekly
An analysis of the price chart with the Central Patterns scanner (detector of chart patterns and resistances and supports) shows a result that can have an impact on the price change:
Near horizontal resistance
Type : Bearish
Timeframe : Weekly
For a small rebound in the very short term, the Central Candlesticks scanner currently notes the presence of this bullish pattern in Japanese candlesticks:
Bullish engulfing lines
Type : Bullish
Timeframe : Weekly
| S3 | S2 | S1 | Price | R1 | |
|---|---|---|---|---|---|
| ProTrendLines | 13.99 | 20.47 | 26.49 | 37.07 | 39.00 |
| Change (%) | -62.26% | -44.78% | -28.54% | - | +5.21% |
| Change | -23.08 | -16.60 | -10.58 | - | +1.93 |
| Level | Minor | Major | Major | - | Intermediate |
To determine price objectives, it is also possible to use the pivot points. Here is the price position in relation to pivot points:
| Pivot points | S3 | S2 | S1 | PP | R1 | R2 | R3 |
|---|---|---|---|---|---|---|---|
| Standard | 35.58 | 36.09 | 36.46 | 36.97 | 37.34 | 37.85 | 38.22 |
| Camarilla | 36.60 | 36.68 | 36.76 | 36.84 | 36.92 | 37.00 | 37.08 |
| Woodie | 35.52 | 36.06 | 36.40 | 36.94 | 37.28 | 37.82 | 38.16 |
| Fibonacci | 36.09 | 36.42 | 36.63 | 36.97 | 37.30 | 37.51 | 37.85 |
| Pivot points | S3 | S2 | S1 | PP | R1 | R2 | R3 |
|---|---|---|---|---|---|---|---|
| Standard | 34.27 | 35.33 | 36.08 | 37.14 | 37.89 | 38.95 | 39.70 |
| Camarilla | 36.34 | 36.51 | 36.67 | 36.84 | 37.01 | 37.17 | 37.34 |
| Woodie | 34.13 | 35.25 | 35.94 | 37.06 | 37.75 | 38.87 | 39.56 |
| Fibonacci | 35.33 | 36.02 | 36.45 | 37.14 | 37.83 | 38.26 | 38.95 |
| Pivot points | S3 | S2 | S1 | PP | R1 | R2 | R3 |
|---|---|---|---|---|---|---|---|
| Standard | 12.21 | 16.72 | 24.10 | 28.61 | 35.99 | 40.50 | 47.88 |
| Camarilla | 28.21 | 29.30 | 30.39 | 31.48 | 32.57 | 33.66 | 34.75 |
| Woodie | 13.65 | 17.44 | 25.54 | 29.33 | 37.43 | 41.22 | 49.32 |
| Fibonacci | 16.72 | 21.26 | 24.07 | 28.61 | 33.15 | 35.96 | 40.50 |
Numerical data
The following is the status of the technical indicators and moving averages at the time of publication of this technical analysis:
| RSI (14): | 71.97 | |
| MACD (12,26,9): | 3.7700 | |
| Directional Movement: | 24.03 | |
| AROON (14): | 50.00 | |
| DEMA (21): | 34.75 | |
| Parabolic SAR (0,02-0,02-0,2): | 25.89 | |
| Elder Ray (13): | 4.36 | |
| Super Trend (3,10): | 28.47 | |
| Zig ZAG (10): | 36.96 | |
| VORTEX (21): | 1.2400 | |
| Stochastique (14,3,5): | 94.62 | |
| TEMA (21): | 36.47 | |
| Williams %R (14): | -7.16 | |
| Chande Momentum Oscillator (20): | 8.91 | |
| Repulse (5,40,3): | 7.8000 | |
| ROCnROLL: | 1 | |
| TRIX (15,9): | 1.7600 | |
| Courbe Coppock: | 82.95 |
| MA7: | 37.16 | |
| MA20: | 35.12 | |
| MA50: | 31.54 | |
| MA100: | 27.81 | |
| MAexp7: | 34.60 | |
| MAexp20: | 30.13 | |
| MAexp50: | 24.88 | |
| MAexp100: | 21.13 | |
| Price / MA7: | -0.24% | |
| Price / MA20: | +5.55% | |
| Price / MA50: | +17.53% | |
| Price / MA100: | +33.30% | |
| Price / MAexp7: | +7.14% | |
| Price / MAexp20: | +23.03% | |
| Price / MAexp50: | +49.00% | |
| Price / MAexp100: | +75.44% |
News
Don't forget to follow the news on PALANTIR TECHNOLOGIES. At the time of publication of this analysis, the latest news was as follows:
- SHAREHOLDER ACTION REMINDER: The Schall Law Firm Encourages Investors in Palantir Technologies Inc. with Losses of $100,000 to Contact the Firm
- INVESTOR ACTION REMINDER: The Schall Law Firm Encourages Investors in Palantir Technologies Inc. with Losses of $100,000 to Contact the Firm
- INVESTOR ACTION NOTICE: The Schall Law Firm Encourages Investors in Palantir Technologies Inc. with Losses of $500,000 to Contact the Firm
- BigBear.ai And Palantir Announce Strategic Partnership, Combining AI-powered Products With Next Generation Operating Platform
- Greek Government and Palantir Reaffirm Digital Transformation Partnership
About author

Online


Add a comment
Comments
0 comments on the analysis PALANTIR TECHNOLOGIES - Weekly