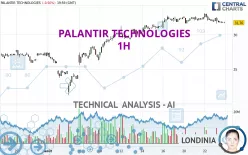
PALANTIR TECHNOLOGIES - 1H - Technical analysis published on 08/26/2024 (GMT)
- 136
- 0
Click here for a new analysis!
- Timeframe : 1H
- - Analysis generated on
- Status : INVALID

Summary of the analysis

Additional analysis
Quotes
PALANTIR TECHNOLOGIES rating 31.78 USD. On the day, this instrument lost -0.44% and was between 31.62 USD and 32.55 USD. This implies that the price is at +0.51% from its lowest and at -2.37% from its highest.The Central Gaps scanner detects a bullish opening. A small advantage for buyers in the very short term.
Bullish opening
Type : Bullish
Timeframe : Openning
A study of price movements over other periods shows the following variations:
Near a new HIGH record (1 year)
Type : Bullish
Timeframe : Weekly
Near a new HIGH record (1st january)
Type : Bullish
Timeframe : Weekly
Near a new HIGH record (1 month)
Type : Bullish
Timeframe : Weekly
Technical
A technical analysis in 1H of this PALANTIR TECHNOLOGIES chart shows a bullish trend. 67.86% of the signals given by moving averages are bullish. Caution: the slightly bearish signals currently being given by short-term moving averages indicate that this bullish trend may be running out of steam. The Central Indicators market scanner currently does not detect any result that concerns moving averages.
The probability of a further decline is moderate given the direction of the technical indicators.
Caution: the Central Indicators scanner currently detects an excess:
CCI indicator is oversold : under -100
Type : Neutral
Timeframe : 1 hour
Williams %R indicator is oversold : under -80
Type : Neutral
Timeframe : 1 hour
An analysis of the price chart with the Central Patterns scanner (detector of chart patterns and resistances and supports) shows a result that can have an impact on the price change:
Near horizontal support
Type : Bullish
Timeframe : 1 hour
The Central Candlesticks scanner which studies Japanese candlesticks did not detect anything.
| S3 | S2 | S1 | Price | R1 | R2 | |
|---|---|---|---|---|---|---|
| ProTrendLines | 26.49 | 28.83 | 31.62 | 31.78 | 32.73 | 39.00 |
| Change (%) | -16.65% | -9.28% | -0.50% | - | +2.99% | +22.72% |
| Change | -5.29 | -2.95 | -0.16 | - | +0.95 | +7.22 |
| Level | Intermediate | Major | Intermediate | - | Intermediate | Intermediate |
Attention could also be paid to pivot points to set price objectives:
| Pivot points | S3 | S2 | S1 | PP | R1 | R2 | R3 |
|---|---|---|---|---|---|---|---|
| Standard | 30.49 | 31.05 | 31.42 | 31.98 | 32.35 | 32.91 | 33.28 |
| Camarilla | 31.52 | 31.61 | 31.70 | 31.78 | 31.87 | 31.95 | 32.04 |
| Woodie | 30.39 | 31.00 | 31.32 | 31.93 | 32.25 | 32.86 | 33.18 |
| Fibonacci | 31.05 | 31.41 | 31.63 | 31.98 | 32.34 | 32.56 | 32.91 |
| Pivot points | S3 | S2 | S1 | PP | R1 | R2 | R3 |
|---|---|---|---|---|---|---|---|
| Standard | 26.50 | 27.89 | 29.98 | 31.37 | 33.46 | 34.85 | 36.94 |
| Camarilla | 31.12 | 31.44 | 31.76 | 32.08 | 32.40 | 32.72 | 33.04 |
| Woodie | 26.86 | 28.07 | 30.34 | 31.55 | 33.82 | 35.03 | 37.30 |
| Fibonacci | 27.89 | 29.22 | 30.04 | 31.37 | 32.70 | 33.52 | 34.85 |
| Pivot points | S3 | S2 | S1 | PP | R1 | R2 | R3 |
|---|---|---|---|---|---|---|---|
| Standard | 20.05 | 22.60 | 24.74 | 27.29 | 29.43 | 31.98 | 34.12 |
| Camarilla | 25.60 | 26.03 | 26.46 | 26.89 | 27.32 | 27.75 | 28.18 |
| Woodie | 19.86 | 22.50 | 24.55 | 27.19 | 29.24 | 31.88 | 33.93 |
| Fibonacci | 22.60 | 24.39 | 25.50 | 27.29 | 29.08 | 30.19 | 31.98 |
Numerical data
The following is the status of technical indicators and moving averages registered at the time this technical analysis was created:
| RSI (14): | 44.54 | |
| MACD (12,26,9): | -0.0600 | |
| Directional Movement: | -2.85 | |
| AROON (14): | -57.15 | |
| DEMA (21): | 32.01 | |
| Parabolic SAR (0,02-0,02-0,2): | 32.48 | |
| Elder Ray (13): | -0.22 | |
| Super Trend (3,10): | 31.53 | |
| Zig ZAG (10): | 31.76 | |
| VORTEX (21): | 0.9300 | |
| Stochastique (14,3,5): | 9.49 | |
| TEMA (21): | 31.75 | |
| Williams %R (14): | -90.73 | |
| Chande Momentum Oscillator (20): | -0.82 | |
| Repulse (5,40,3): | -0.4600 | |
| ROCnROLL: | -1 | |
| TRIX (15,9): | 0.0100 | |
| Courbe Coppock: | 3.15 |
| MA7: | 32.05 | |
| MA20: | 29.13 | |
| MA50: | 27.55 | |
| MA100: | 24.80 | |
| MAexp7: | 31.87 | |
| MAexp20: | 32.04 | |
| MAexp50: | 31.69 | |
| MAexp100: | 30.69 | |
| Price / MA7: | -0.84% | |
| Price / MA20: | +9.10% | |
| Price / MA50: | +15.35% | |
| Price / MA100: | +28.15% | |
| Price / MAexp7: | -0.35% | |
| Price / MAexp20: | -0.87% | |
| Price / MAexp50: | +0.22% | |
| Price / MAexp100: | +3.49% |
News
The latest news and videos published on PALANTIR TECHNOLOGIES at the time of the analysis were as follows:
- SHAREHOLDER ACTION REMINDER: The Schall Law Firm Encourages Investors in Palantir Technologies Inc. with Losses of $100,000 to Contact the Firm
- INVESTOR ACTION REMINDER: The Schall Law Firm Encourages Investors in Palantir Technologies Inc. with Losses of $100,000 to Contact the Firm
- INVESTOR ACTION NOTICE: The Schall Law Firm Encourages Investors in Palantir Technologies Inc. with Losses of $500,000 to Contact the Firm
- BigBear.ai And Palantir Announce Strategic Partnership, Combining AI-powered Products With Next Generation Operating Platform
- Greek Government and Palantir Reaffirm Digital Transformation Partnership
About author

Online


Add a comment
Comments
0 comments on the analysis PALANTIR TECHNOLOGIES - 1H