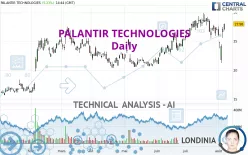
PALANTIR TECHNOLOGIES - Daily - Technical analysis published on 08/07/2024 (GMT)
- 188
- 0
Click here for a new analysis!
- Timeframe : Daily
- - Analysis generated on
- Status : TARGET REACHED

Summary of the analysis

Additional analysis
Quotes
The PALANTIR TECHNOLOGIES price is 27.98 USD. On the day, this instrument gained +5.23% with the lowest point at 26.82 USD and the highest point at 28.00 USD. The deviation from the price is +4.33% for the low point and -0.07% for the high point.So that you have an overall view of the price change, here is a table showing the variations over several periods:
Technical
Technical analysis of this Daily chart of PALANTIR TECHNOLOGIES indicates that the overall trend is strongly bullish. 89.29% of the signals given by moving averages are bullish. The slightly bullish signals given by the short-term moving averages show a weakening of the global trend. The Central Indicators market scanner is currently detecting several bullish signals that could impact this trend:
Bullish trend reversal : Moving Average 100
Type : Bullish
Timeframe : Daily
Bullish trend reversal : adaptative moving average 20
Type : Bullish
Timeframe : Daily
Bullish trend reversal : adaptative moving average 50
Type : Bullish
Timeframe : Daily
Bullish price crossover with Moving Average 20
Type : Bullish
Timeframe : Daily
Bullish price crossover with adaptative moving average 20
Type : Bullish
Timeframe : Daily
In fact, of the 18 technical indicators analysed by Central Analyzer, 11 are bullish, 3 are neutral and 4 are bearish. Other results related to technical indicators were also found by the Central Indicators scanner:
Pivot points : price is over resistance 1
Type : Neutral
Timeframe : Daily
Pivot points : price is over resistance 1
Type : Neutral
Timeframe : Weekly
SuperTrend indicator bullish reversal
Type : Bullish
Timeframe : Daily
MACD indicator is back over 0
Type : Bullish
Timeframe : Daily
The Central Patterns scanner, which studies chart patterns, resistances and supports, has identified this signal:
Near horizontal support
Type : Bullish
Timeframe : Daily
The Central Candlesticks scanner which studies Japanese candlesticks did not detect anything.
| S3 | S2 | S1 | Price | R1 | R2 | |
|---|---|---|---|---|---|---|
| ProTrendLines | 22.76 | 25.20 | 26.53 | 27.98 | 28.83 | 39.00 |
| Change (%) | -18.66% | -9.94% | -5.18% | - | +3.04% | +39.39% |
| Change | -5.22 | -2.78 | -1.45 | - | +0.85 | +11.02 |
| Level | Minor | Intermediate | Major | - | Major | Minor |
To determine price objectives, it is also possible to use the pivot points. Here is the price position in relation to pivot points:
| Pivot points | S3 | S2 | S1 | PP | R1 | R2 | R3 |
|---|---|---|---|---|---|---|---|
| Standard | 23.78 | 24.68 | 25.63 | 26.53 | 27.48 | 28.38 | 29.33 |
| Camarilla | 26.08 | 26.25 | 26.42 | 26.59 | 26.76 | 26.93 | 27.10 |
| Woodie | 23.82 | 24.69 | 25.67 | 26.54 | 27.52 | 28.39 | 29.37 |
| Fibonacci | 24.68 | 25.38 | 25.82 | 26.53 | 27.23 | 27.67 | 28.38 |
| Pivot points | S3 | S2 | S1 | PP | R1 | R2 | R3 |
|---|---|---|---|---|---|---|---|
| Standard | 19.01 | 21.38 | 23.06 | 25.43 | 27.11 | 29.48 | 31.16 |
| Camarilla | 23.63 | 24.00 | 24.37 | 24.74 | 25.11 | 25.48 | 25.85 |
| Woodie | 18.67 | 21.21 | 22.72 | 25.26 | 26.77 | 29.31 | 30.82 |
| Fibonacci | 21.38 | 22.93 | 23.88 | 25.43 | 26.98 | 27.93 | 29.48 |
| Pivot points | S3 | S2 | S1 | PP | R1 | R2 | R3 |
|---|---|---|---|---|---|---|---|
| Standard | 20.05 | 22.60 | 24.74 | 27.29 | 29.43 | 31.98 | 34.12 |
| Camarilla | 25.60 | 26.03 | 26.46 | 26.89 | 27.32 | 27.75 | 28.18 |
| Woodie | 19.86 | 22.50 | 24.55 | 27.19 | 29.24 | 31.88 | 33.93 |
| Fibonacci | 22.60 | 24.39 | 25.50 | 27.29 | 29.08 | 30.19 | 31.98 |
Numerical data
The following is the status of the technical indicators and moving averages at the time of publication of this technical analysis:
| RSI (14): | 56.75 | |
| MACD (12,26,9): | 0.0700 | |
| Directional Movement: | -7.89 | |
| AROON (14): | -85.71 | |
| DEMA (21): | 26.90 | |
| Parabolic SAR (0,02-0,02-0,2): | 21.23 | |
| Elder Ray (13): | 0.82 | |
| Super Trend (3,10): | 22.15 | |
| Zig ZAG (10): | 27.75 | |
| VORTEX (21): | 0.9300 | |
| Stochastique (14,3,5): | 57.99 | |
| TEMA (21): | 26.26 | |
| Williams %R (14): | -21.15 | |
| Chande Momentum Oscillator (20): | -0.65 | |
| Repulse (5,40,3): | 8.2300 | |
| ROCnROLL: | 1 | |
| TRIX (15,9): | 0.2000 | |
| Courbe Coppock: | 15.31 |
| MA7: | 26.10 | |
| MA20: | 27.29 | |
| MA50: | 25.48 | |
| MA100: | 23.94 | |
| MAexp7: | 26.47 | |
| MAexp20: | 26.63 | |
| MAexp50: | 25.71 | |
| MAexp100: | 24.26 | |
| Price / MA7: | +7.20% | |
| Price / MA20: | +2.53% | |
| Price / MA50: | +9.81% | |
| Price / MA100: | +16.88% | |
| Price / MAexp7: | +5.70% | |
| Price / MAexp20: | +5.07% | |
| Price / MAexp50: | +8.83% | |
| Price / MAexp100: | +15.33% |
News
The last news published on PALANTIR TECHNOLOGIES at the time of the generation of this analysis was as follows:
- SHAREHOLDER ACTION REMINDER: The Schall Law Firm Encourages Investors in Palantir Technologies Inc. with Losses of $100,000 to Contact the Firm
- INVESTOR ACTION REMINDER: The Schall Law Firm Encourages Investors in Palantir Technologies Inc. with Losses of $100,000 to Contact the Firm
- INVESTOR ACTION NOTICE: The Schall Law Firm Encourages Investors in Palantir Technologies Inc. with Losses of $500,000 to Contact the Firm
- BigBear.ai And Palantir Announce Strategic Partnership, Combining AI-powered Products With Next Generation Operating Platform
- Greek Government and Palantir Reaffirm Digital Transformation Partnership
About author

Online


Add a comment
Comments
0 comments on the analysis PALANTIR TECHNOLOGIES - Daily