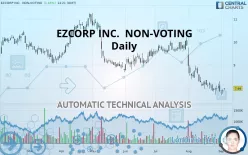
EZCORP INC. NON-VOTING - Daily - Technical analysis published on 09/05/2019 (GMT)
- 228
- 0
- Who voted?
Click here for a new analysis!
- Timeframe : Daily
- - Analysis generated on
- Status : TARGET REACHED

Summary of the analysis

Additional analysis
Quotes
The EZCORP INC. NON-VOTING price is 7.99 USD. On the day, this instrument gained +1.65% and was between 7.92 USD and 8.00 USD. This implies that the price is at +0.88% from its lowest and at -0.13% from its highest.The Central Gaps scanner detects the formation of a bullish gap marking the strong presence of buyers against sellers at the opening. This formed a quotation gap.
Opening Gap UP
Type : Bullish
Timeframe : Openning
Here is a more detailed summary of the historical variations registered by EZCORP INC. NON-VOTING:
Near a new LOW record (1st january)
Type : Bearish
Timeframe : Weekly
Near a new LOW record (1 month)
Type : Bearish
Timeframe : Weekly
Technical
Technical analysis of EZCORP INC. NON-VOTING in Daily shows a overall strongly bearish trend. 92.86% of the signals given by moving averages are bearish. This strongly bearish trend is supported by the strong bearish signals given by short-term moving averages. The Central Indicators scanner does not detect any result on moving averages that would impact this trend.
On the 18 technical indicators analysed, 4 are bullish, 6 are neutral and 8 are bearish. Caution: the Central Indicators scanner currently detects an excess:
CCI indicator is oversold : under -100
Type : Neutral
Timeframe : Daily
Williams %R indicator is overbought : over -20
Type : Neutral
Timeframe : Daily
Price is back under the pivot point
Type : Bearish
Timeframe : Weekly
No signals are given by Central Patterns, a market scanner specialised in chart patterns, resistances and supports.
The Central Candlesticks scanner which studies Japanese candlesticks did not detect anything.
| S3 | S2 | S1 | Price | R1 | R2 | R3 | |
|---|---|---|---|---|---|---|---|
| ProTrendLines | 2.43 | 6.34 | 7.63 | 7.99 | 9.10 | 9.53 | 10.35 |
| Change (%) | -69.59% | -20.65% | -4.51% | - | +13.89% | +19.27% | +29.54% |
| Change | -5.56 | -1.65 | -0.36 | - | +1.11 | +1.54 | +2.36 |
| Level | Major | Minor | Major | - | Major | Major | Intermediate |
To determine price objectives, it is also possible to use the pivot points. Here is the price position in relation to pivot points:
| Pivot points | S3 | S2 | S1 | PP | R1 | R2 | R3 |
|---|---|---|---|---|---|---|---|
| Standard | 7.57 | 7.67 | 7.76 | 7.86 | 7.95 | 8.05 | 8.14 |
| Camarilla | 7.81 | 7.83 | 7.84 | 7.86 | 7.88 | 7.90 | 7.91 |
| Woodie | 7.58 | 7.67 | 7.77 | 7.86 | 7.96 | 8.05 | 8.15 |
| Fibonacci | 7.67 | 7.74 | 7.78 | 7.86 | 7.93 | 7.97 | 8.05 |
| Pivot points | S3 | S2 | S1 | PP | R1 | R2 | R3 |
|---|---|---|---|---|---|---|---|
| Standard | 7.06 | 7.39 | 7.63 | 7.96 | 8.20 | 8.53 | 8.77 |
| Camarilla | 7.71 | 7.77 | 7.82 | 7.87 | 7.92 | 7.98 | 8.03 |
| Woodie | 7.02 | 7.37 | 7.59 | 7.94 | 8.16 | 8.51 | 8.73 |
| Fibonacci | 7.39 | 7.61 | 7.74 | 7.96 | 8.18 | 8.31 | 8.53 |
| Pivot points | S3 | S2 | S1 | PP | R1 | R2 | R3 |
|---|---|---|---|---|---|---|---|
| Standard | 5.10 | 6.41 | 7.14 | 8.45 | 9.18 | 10.49 | 11.22 |
| Camarilla | 7.31 | 7.50 | 7.68 | 7.87 | 8.06 | 8.24 | 8.43 |
| Woodie | 4.81 | 6.27 | 6.85 | 8.31 | 8.89 | 10.35 | 10.93 |
| Fibonacci | 6.41 | 7.19 | 7.67 | 8.45 | 9.23 | 9.71 | 10.49 |
Numerical data
The following is the status of technical indicators and moving averages registered at the time this technical analysis was created:
| RSI (14): | 37.13 | |
| MACD (12,26,9): | -0.3100 | |
| Directional Movement: | -9.02 | |
| AROON (14): | -71.42 | |
| DEMA (21): | 7.77 | |
| Parabolic SAR (0,02-0,02-0,2): | 8.28 | |
| Elder Ray (13): | -0.09 | |
| Super Trend (3,10): | 8.63 | |
| Zig ZAG (10): | 8.00 | |
| VORTEX (21): | 0.8700 | |
| Stochastique (14,3,5): | 30.30 | |
| TEMA (21): | 7.72 | |
| Williams %R (14): | -56.06 | |
| Chande Momentum Oscillator (20): | -0.16 | |
| Repulse (5,40,3): | -0.6400 | |
| ROCnROLL: | 2 | |
| TRIX (15,9): | -0.5800 | |
| Courbe Coppock: | 9.29 |
| MA7: | 7.93 | |
| MA20: | 8.13 | |
| MA50: | 8.97 | |
| MA100: | 9.34 | |
| MAexp7: | 7.93 | |
| MAexp20: | 8.20 | |
| MAexp50: | 8.70 | |
| MAexp100: | 9.07 | |
| Price / MA7: | +0.76% | |
| Price / MA20: | -1.72% | |
| Price / MA50: | -10.93% | |
| Price / MA100: | -14.45% | |
| Price / MAexp7: | +0.76% | |
| Price / MAexp20: | -2.56% | |
| Price / MAexp50: | -8.16% | |
| Price / MAexp100: | -11.91% |
News
The last news published on EZCORP INC. NON-VOTING at the time of the generation of this analysis was as follows:
- EZCORP, Inc. Class A to Host Earnings Call
- Lifshitz & Miller LLP Announces Investigation of EZCORP, Inc., Flowserve Corporation, Halliburton Company, NCI, Inc., Parkway, Inc., United Therapeutics Corporation and ViewRay, Inc.
- Long Term EZCORP Investors: Shareholder Rights Law Firm J&W Initiates Investigation of EZCORP, Inc.; Encourages Investors to Contact the Firm
-
 EZCORP
- EZCORP Announces First Quarter Fiscal 2017 Results
About author

Online


Add a comment
Comments
0 comments on the analysis EZCORP INC. NON-VOTING - Daily