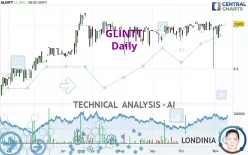
GLINTT - Daily - Technical analysis published on 11/11/2024 (GMT)
- 123
- 0
Click here for a new analysis!
- Timeframe : Daily
- - Analysis generated on
- Status : LEVEL MAINTAINED

Summary of the analysis

Additional analysis
Quotes
GLINTT rating 0.505 EUR. The price has increased by +1.00% since the last closing and was traded between 0.505 EUR and 0.505 EUR over the period. The price is currently at 0% from its lowest and 0% from its highest.The Central Gaps scanner detects the formation of a bullish gap marking the strong presence of buyers against sellers at the opening. This formed a quotation gap.
Opening Gap UP
Type : Bullish
Timeframe : Openning
Here is a more detailed summary of the historical variations registered by GLINTT:
Near a new HIGH record (5 years)
Type : Bullish
Timeframe : Weekly
Near a new HIGH record (1 year)
Type : Bullish
Timeframe : Weekly
Near a new HIGH record (1st january)
Type : Bullish
Timeframe : Weekly
Near a new HIGH record (1 month)
Type : Bullish
Timeframe : Weekly
Technical
Technical analysis of GLINTT in Daily shows a strongly overall bullish trend. 92.86% of the signals given by moving averages are bullish. This strongly bullish trend is supported by the strong bullish signals given by short-term moving averages. The Central Indicators market scanner is currently detecting a bullish signal that could impact this trend:
Bullish price crossover with Moving Average 20
Type : Bullish
Timeframe : Daily
An assessment of technical indicators shows a moderate bullish signal.
Caution: the Central Indicators scanner currently detects an excess:
Williams %R indicator is overbought : over -20
Type : Neutral
Timeframe : Daily
Pivot points : price is over resistance 3
Type : Neutral
Timeframe : Daily
Momentum indicator is back under 0
Type : Bearish
Timeframe : Daily
An analysis of the price chart with the Central Patterns scanner (detector of chart patterns and resistances and supports) shows several results that can have an impact on the price change:
Near resistance of channel
Type : Bearish
Timeframe : Daily
Near resistance of triangle
Type : Bearish
Timeframe : Daily
There is also a Japanese candlestick pattern detected by Central Candlesticks that could mark the end of the current short-term trend:
Doji
Type : Neutral
Timeframe : Daily
| S3 | S2 | S1 | Price | R1 | R2 | R3 | |
|---|---|---|---|---|---|---|---|
| ProTrendLines | 0.381 | 0.419 | 0.452 | 0.505 | 0.510 | 0.541 | 0.881 |
| Change (%) | -24.55% | -17.03% | -10.50% | - | +0.99% | +7.13% | +74.46% |
| Change | -0.124 | -0.086 | -0.053 | - | +0.005 | +0.036 | +0.376 |
| Level | Intermediate | Major | Major | - | Major | Minor | Major |
To determine price objectives, it is also possible to use the pivot points. Here is the price position in relation to pivot points:
| Pivot points | S3 | S2 | S1 | PP | R1 | R2 | R3 |
|---|---|---|---|---|---|---|---|
| Standard | 0.500 | 0.500 | 0.500 | 0.500 | 0.500 | 0.500 | 0.500 |
| Camarilla | 0.500 | 0.500 | 0.500 | 0.500 | 0.500 | 0.500 | 0.500 |
| Woodie | 0.500 | 0.500 | 0.500 | 0.500 | 0.500 | 0.500 | 0.500 |
| Fibonacci | 0.500 | 0.500 | 0.500 | 0.500 | 0.500 | 0.500 | 0.500 |
| Pivot points | S3 | S2 | S1 | PP | R1 | R2 | R3 |
|---|---|---|---|---|---|---|---|
| Standard | 0.447 | 0.459 | 0.480 | 0.492 | 0.513 | 0.525 | 0.546 |
| Camarilla | 0.491 | 0.494 | 0.497 | 0.500 | 0.503 | 0.506 | 0.509 |
| Woodie | 0.451 | 0.461 | 0.484 | 0.494 | 0.517 | 0.527 | 0.550 |
| Fibonacci | 0.459 | 0.472 | 0.480 | 0.492 | 0.505 | 0.513 | 0.525 |
| Pivot points | S3 | S2 | S1 | PP | R1 | R2 | R3 |
|---|---|---|---|---|---|---|---|
| Standard | 0.317 | 0.359 | 0.427 | 0.469 | 0.537 | 0.579 | 0.647 |
| Camarilla | 0.466 | 0.476 | 0.486 | 0.496 | 0.506 | 0.516 | 0.526 |
| Woodie | 0.331 | 0.366 | 0.441 | 0.476 | 0.551 | 0.586 | 0.661 |
| Fibonacci | 0.359 | 0.401 | 0.427 | 0.469 | 0.511 | 0.537 | 0.579 |
Numerical data
The following is the status of the technical indicators and moving averages at the time of publication of this technical analysis:
| RSI (14): | 54.85 | |
| MACD (12,26,9): | 0.0020 | |
| Directional Movement: | -34.680 | |
| AROON (14): | -35.714 | |
| DEMA (21): | 0.503 | |
| Parabolic SAR (0,02-0,02-0,2): | 0.406 | |
| Elder Ray (13): | 0.004 | |
| Super Trend (3,10): | 0.472 | |
| Zig ZAG (10): | 0.505 | |
| VORTEX (21): | 0.9270 | |
| Stochastique (14,3,5): | 92.42 | |
| TEMA (21): | 0.501 | |
| Williams %R (14): | -4.55 | |
| Chande Momentum Oscillator (20): | -0.005 | |
| Repulse (5,40,3): | 3.0970 | |
| ROCnROLL: | 1 | |
| TRIX (15,9): | 0.0650 | |
| Courbe Coppock: | 1.31 |
| MA7: | 0.500 | |
| MA20: | 0.502 | |
| MA50: | 0.494 | |
| MA100: | 0.490 | |
| MAexp7: | 0.501 | |
| MAexp20: | 0.500 | |
| MAexp50: | 0.494 | |
| MAexp100: | 0.477 | |
| Price / MA7: | +1.00% | |
| Price / MA20: | +0.60% | |
| Price / MA50: | +2.23% | |
| Price / MA100: | +3.06% | |
| Price / MAexp7: | +0.80% | |
| Price / MAexp20: | +1.00% | |
| Price / MAexp50: | +2.23% | |
| Price / MAexp100: | +5.87% |
About author
Online


Add a comment
Comments
0 comments on the analysis GLINTT - Daily