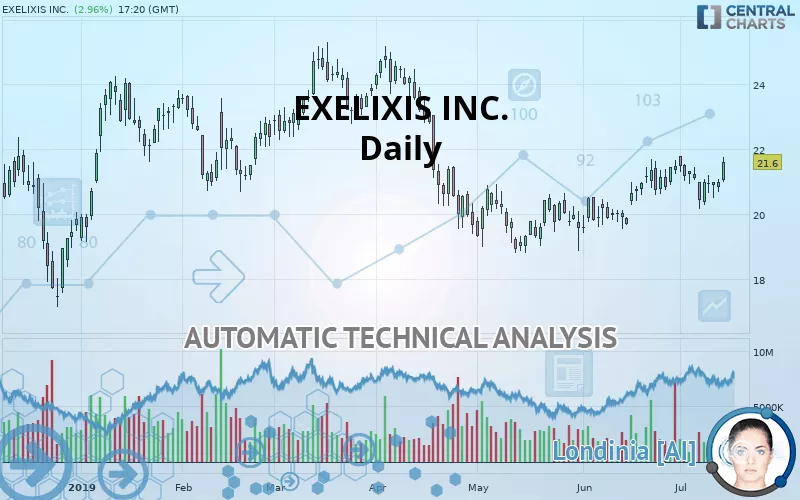
EXELIXIS INC. - Daily - Technical analysis published on 07/15/2019 (GMT)
- 376
- 0
Click here for a new analysis!
- Timeframe : Daily
- - Analysis generated on
- Status : INVALID

Summary of the analysis

Additional analysis
Quotes
The EXELIXIS INC. price is 21.60 USD. On the day, this instrument gained +2.96% with the lowest point at 21.00 USD and the highest point at 21.75 USD. The deviation from the price is +2.86% for the low point and -0.69% for the high point.The Central Gaps scanner detects a bullish opening. A small advantage for buyers in the very short term.
Bullish opening
Type : Bullish
Timeframe : Openning
A study of price movements over other periods shows the following variations:
Near a new HIGH record (1 month)
Type : Bullish
Timeframe : Weekly
Technical
Technical analysis of this Daily chart of EXELIXIS INC. indicates that the overall trend is bullish. 75% of the signals given by moving averages are bullish. The overall trend is reinforced by the strong bullish signals from short-term moving averages. An assessment of moving averages reveals a bullish signal that could impact this trend:
Bullish price crossover with Moving Average 20
Type : Bullish
Timeframe : Daily
In fact, 10 technical indicators on 18 studied are currently bullish. But beware of excesses. The Central Indicators scanner currently detects this:
Williams %R indicator is overbought : over -20
Type : Neutral
Timeframe : Daily
Pivot points : price is over resistance 1
Type : Neutral
Timeframe : Weekly
Pivot points : price is over resistance 3
Type : Neutral
Timeframe : Daily
Momentum indicator is back under 0
Type : Bearish
Timeframe : Daily
The Central Patterns scanner, which studies chart patterns, resistances and supports, has identified these signals:
Near horizontal resistance
Type : Bearish
Timeframe : Daily
Resistance of channel is broken
Type : Bullish
Timeframe : Daily
Resistance of triangle is broken
Type : Bullish
Timeframe : Daily
The Central Candlesticks scanner which studies Japanese candlesticks did not detect anything.
| S3 | S2 | S1 | Price | R1 | R2 | R3 | |
|---|---|---|---|---|---|---|---|
| ProTrendLines | 18.32 | 20.49 | 21.48 | 21.60 | 23.22 | 24.76 | 29.24 |
| Change (%) | -15.19% | -5.14% | -0.56% | - | +7.50% | +14.63% | +35.37% |
| Change | -3.28 | -1.11 | -0.12 | - | +1.62 | +3.16 | +7.64 |
| Level | Major | Major | Intermediate | - | Intermediate | Intermediate | Intermediate |
Attention could also be paid to pivot points to set price objectives:
| Pivot points | S3 | S2 | S1 | PP | R1 | R2 | R3 |
|---|---|---|---|---|---|---|---|
| Standard | 20.38 | 20.54 | 20.76 | 20.92 | 21.14 | 21.30 | 21.52 |
| Camarilla | 20.88 | 20.91 | 20.95 | 20.98 | 21.02 | 21.05 | 21.09 |
| Woodie | 20.41 | 20.56 | 20.79 | 20.94 | 21.17 | 21.32 | 21.55 |
| Fibonacci | 20.54 | 20.69 | 20.78 | 20.92 | 21.07 | 21.16 | 21.30 |
| Pivot points | S3 | S2 | S1 | PP | R1 | R2 | R3 |
|---|---|---|---|---|---|---|---|
| Standard | 19.30 | 19.73 | 20.35 | 20.79 | 21.41 | 21.85 | 22.47 |
| Camarilla | 20.69 | 20.79 | 20.88 | 20.98 | 21.08 | 21.17 | 21.27 |
| Woodie | 19.39 | 19.78 | 20.45 | 20.84 | 21.51 | 21.89 | 22.57 |
| Fibonacci | 19.73 | 20.13 | 20.38 | 20.79 | 21.19 | 21.44 | 21.85 |
| Pivot points | S3 | S2 | S1 | PP | R1 | R2 | R3 |
|---|---|---|---|---|---|---|---|
| Standard | 17.71 | 18.57 | 19.97 | 20.83 | 22.23 | 23.09 | 24.49 |
| Camarilla | 20.75 | 20.96 | 21.16 | 21.37 | 21.58 | 21.79 | 21.99 |
| Woodie | 17.98 | 18.70 | 20.24 | 20.96 | 22.50 | 23.23 | 24.76 |
| Fibonacci | 18.57 | 19.43 | 19.97 | 20.83 | 21.69 | 22.23 | 23.09 |
Numerical data
The following are the details of the technical indicators and moving averages that were collected to generate this technical analysis:
| RSI (14): | 58.92 | |
| MACD (12,26,9): | 0.1800 | |
| Directional Movement: | 6.25 | |
| AROON (14): | -28.58 | |
| DEMA (21): | 21.19 | |
| Parabolic SAR (0,02-0,02-0,2): | 20.16 | |
| Elder Ray (13): | 0.33 | |
| Super Trend (3,10): | 19.63 | |
| Zig ZAG (10): | 21.60 | |
| VORTEX (21): | 1.0600 | |
| Stochastique (14,3,5): | 60.57 | |
| TEMA (21): | 21.34 | |
| Williams %R (14): | -13.95 | |
| Chande Momentum Oscillator (20): | 0.73 | |
| Repulse (5,40,3): | 4.3600 | |
| ROCnROLL: | 1 | |
| TRIX (15,9): | 0.1600 | |
| Courbe Coppock: | 1.73 |
| MA7: | 21.00 | |
| MA20: | 21.07 | |
| MA50: | 20.38 | |
| MA100: | 21.60 | |
| MAexp7: | 21.13 | |
| MAexp20: | 20.95 | |
| MAexp50: | 20.87 | |
| MAexp100: | 21.00 | |
| Price / MA7: | +2.86% | |
| Price / MA20: | +2.52% | |
| Price / MA50: | +5.99% | |
| Price / MA100: | -0% | |
| Price / MAexp7: | +2.22% | |
| Price / MAexp20: | +3.10% | |
| Price / MAexp50: | +3.50% | |
| Price / MAexp100: | +2.86% |
News
Don"t forget to follow the news on EXELIXIS INC.. At the time of publication of this analysis, the latest news was as follows:
- Exelixis and Iconic Therapeutics Enter into Exclusive Option and License Agreement for Novel Antibody-Drug Conjugate Program
- Exelixis Announces First Quarter 2019 Financial Results and Provides Corporate Update
- Exelixis Announces Fourth Quarter and Full Year 2018 Financial Results and Provides Corporate Update
- Exelixis to Initiate Phase 1 Clinical Development of XL092, First New Compound to Enter the Clinic from Reinitiated Discovery Efforts
- Exelixis to Present at the Guggenheim Healthcare Talks Idea Forum / Oncology Day 2019 on February 14, 2019
About author

Online


Add a comment
Comments
0 comments on the analysis EXELIXIS INC. - Daily