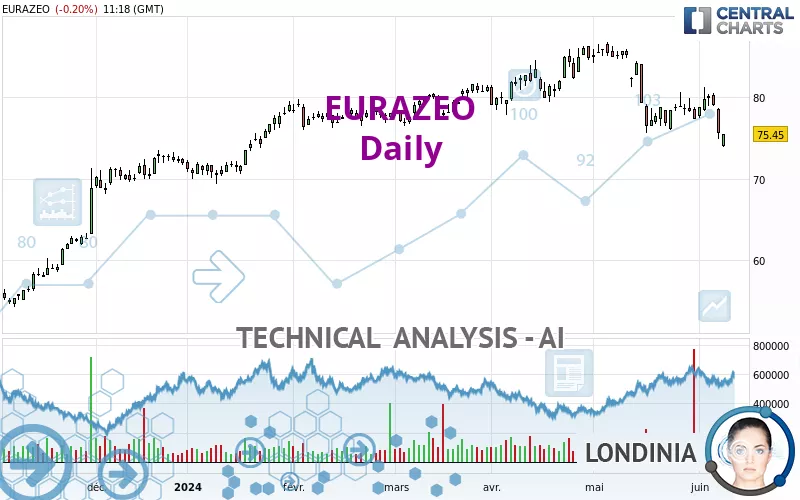
EURAZEO - Daily - Technical analysis published on 06/10/2024 (GMT)
- 118
- 0
Click here for a new analysis!
- Timeframe : Daily
- - Analysis generated on
- Status : TARGET REACHED
Summary of the analysis

Additional analysis
Quotes
EURAZEO rating 75.45 EUR. The price registered a decrease of -0.20% on the session with the lowest point at 73.90 EUR and the highest point at 75.45 EUR. The deviation from the price is +2.10% for the low point and 0% for the high point.The Central Gaps scanner detects a bearish gap which is a sign that the sellers have taken the lead in the very short term.
Opening Gap DOWN
Type : Bearish
Timeframe : Openning
Here is a more detailed summary of the historical variations registered by EURAZEO:
New LOW record (1 month)
Type : Bearish
Timeframe : Weekly
Technical
A technical analysis in Daily of this EURAZEO chart shows a bearish trend. 67.86% of the signals given by moving averages are bearish. The overall trend is reinforced by the strong bearish signals from short-term moving averages. The Central Indicators scanner detects a bearish signal on moving averages that could impact this trend:
Bearish trend reversal : adaptative moving average 100
Type : Bearish
Timeframe : Daily
The probability of a further decline is moderate given the direction of the technical indicators.
Caution: the Central Indicators scanner currently detects an excess:
CCI indicator is oversold : under -100
Type : Neutral
Timeframe : Daily
Williams %R indicator is oversold : under -80
Type : Neutral
Timeframe : Daily
Central Patterns, the market scanner focusing on chart patterns, resistances and supports found this result:
Support of channel is broken
Type : Bearish
Timeframe : Daily
No result was found by the Central Candlesticks scanner on Japanese candlesticks.
| S3 | S2 | S1 | Price | R1 | R2 | R3 | |
|---|---|---|---|---|---|---|---|
| ProTrendLines | 65.35 | 68.62 | 72.97 | 75.45 | 76.67 | 79.59 | 84.15 |
| Change (%) | -13.39% | -9.05% | -3.29% | - | +1.62% | +5.49% | +11.53% |
| Change | -10.10 | -6.83 | -2.48 | - | +1.22 | +4.14 | +8.70 |
| Level | Major | Minor | Intermediate | - | Intermediate | Major | Intermediate |
To determine price objectives, it is also possible to use the pivot points. Here is the price position in relation to pivot points:
| Pivot points | S3 | S2 | S1 | PP | R1 | R2 | R3 |
|---|---|---|---|---|---|---|---|
| Standard | 70.27 | 72.53 | 74.07 | 76.33 | 77.87 | 80.13 | 81.67 |
| Camarilla | 74.56 | 74.90 | 75.25 | 75.60 | 75.95 | 76.30 | 76.65 |
| Woodie | 69.90 | 72.35 | 73.70 | 76.15 | 77.50 | 79.95 | 81.30 |
| Fibonacci | 72.53 | 73.99 | 74.88 | 76.33 | 77.79 | 78.68 | 80.13 |
| Pivot points | S3 | S2 | S1 | PP | R1 | R2 | R3 |
|---|---|---|---|---|---|---|---|
| Standard | 66.73 | 70.77 | 73.18 | 77.22 | 79.63 | 83.67 | 86.08 |
| Camarilla | 73.83 | 74.42 | 75.01 | 75.60 | 76.19 | 76.78 | 77.37 |
| Woodie | 65.93 | 70.36 | 72.38 | 76.81 | 78.83 | 83.26 | 85.28 |
| Fibonacci | 70.77 | 73.23 | 74.75 | 77.22 | 79.68 | 81.20 | 83.67 |
| Pivot points | S3 | S2 | S1 | PP | R1 | R2 | R3 |
|---|---|---|---|---|---|---|---|
| Standard | 64.97 | 70.28 | 73.77 | 79.08 | 82.57 | 87.88 | 91.37 |
| Camarilla | 74.83 | 75.64 | 76.44 | 77.25 | 78.06 | 78.86 | 79.67 |
| Woodie | 64.05 | 69.83 | 72.85 | 78.63 | 81.65 | 87.43 | 90.45 |
| Fibonacci | 70.28 | 73.65 | 75.72 | 79.08 | 82.45 | 84.52 | 87.88 |
Numerical data
The following are the details of the technical indicators and moving averages that were collected to generate this technical analysis:
| RSI (14): | 37.86 | |
| MACD (12,26,9): | -0.8200 | |
| Directional Movement: | -13.37 | |
| AROON (14): | -28.57 | |
| DEMA (21): | 77.68 | |
| Parabolic SAR (0,02-0,02-0,2): | 81.12 | |
| Elder Ray (13): | -3.47 | |
| Super Trend (3,10): | 80.90 | |
| Zig ZAG (10): | 75.45 | |
| VORTEX (21): | 0.7900 | |
| Stochastique (14,3,5): | 30.79 | |
| TEMA (21): | 76.85 | |
| Williams %R (14): | -78.91 | |
| Chande Momentum Oscillator (20): | -1.35 | |
| Repulse (5,40,3): | -0.7400 | |
| ROCnROLL: | 2 | |
| TRIX (15,9): | -0.1100 | |
| Courbe Coppock: | 2.92 |
| MA7: | 78.00 | |
| MA20: | 78.58 | |
| MA50: | 79.79 | |
| MA100: | 77.80 | |
| MAexp7: | 77.51 | |
| MAexp20: | 78.62 | |
| MAexp50: | 78.82 | |
| MAexp100: | 76.48 | |
| Price / MA7: | -3.27% | |
| Price / MA20: | -3.98% | |
| Price / MA50: | -5.44% | |
| Price / MA100: | -3.02% | |
| Price / MAexp7: | -2.66% | |
| Price / MAexp20: | -4.03% | |
| Price / MAexp50: | -4.28% | |
| Price / MAexp100: | -1.35% |
News
The latest news and videos published on EURAZEO at the time of the analysis were as follows:
- Ares, Eurazeo, Barings Among Top 2023 European Direct Lenders - Lower Mid Market Deals Account for 80% of Transactions Despite Record Unitranche Size Raised
- Alt Mobility raises $6mn in Funding Co-led by Shell Ventures, Eurazeo, EV2 and Twynam
- Alt Mobility raises $6mn in Funding Co-led by Shell Ventures, Eurazeo, EV2 and Twynam
- Eurazeo Announces Sale of Majority Ownership Position in NEST New York to North Castle Partners Led Investor Group
- Private Equity Women Investor Network Names Eurazeo 2022 International General Partner of the Year
About author
Online


Add a comment
Comments
0 comments on the analysis EURAZEO - Daily