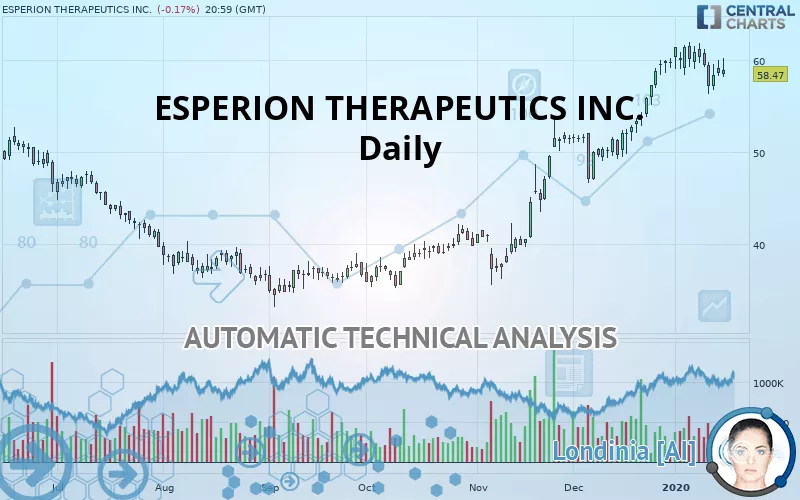
ESPERION THERAPEUTICS INC. - Daily - Technical analysis published on 01/17/2020 (GMT)
- 245
- 0
Oops, I was wrong about that analysis. My threshold for invalidation has been broken.
Click here for a new analysis!
Click here for a new analysis!
- Timeframe : Daily
- - Analysis generated on
- Status : INVALID

Summary of the analysis
Trends
Court terme:
Strongly bullish
De fond:
Strongly bullish
Technical indicators
22%
39%
39%
My opinion
Bullish above 55.48 USD
My targets
61.38 USD (+4.98%)
66.19 USD (+13.20%)
My analysis
The bullish trend is currently very strong on ESPERION THERAPEUTICS INC.. As long as the price remains above the support at 55.48 USD, you could try to benefit from the boom. The first bullish objective is located at 61.38 USD. The bullish momentum would be boosted by a break in this resistance. Buyers would then use the next resistance located at 66.19 USD as an objective. Crossing it would then enable buyers to target 80.76 USD. Be careful, given the powerful bullish rally underway, excesses could lead to a possible correction in the short term. If this is the case, remember that trading against the trend may be riskier. It would seem more appropriate to wait for a signal indicating reversal of the trend.
In the very short term, the general bullish sentiment is not called into question, despite technical indicators being indecisive.
FORCE
0
10
5.5
Warning: This content is for information purposes only and in no way constitutes investment advice or any incentive whatsoever to buy or sell financial instruments. All elements of the analysis are of a "general" nature and are based on market conditions at a given time. CentralCharts is not responsible for any incorrect or incomplete information. Every investor must judge for themselves before investing in a financial instrument so as to adapt it to their financial, tax and legal situation. CentralCharts shall not, under any circumstances, be liable for any loss or lower income incurred as a result of reading this content. Trading in financial instruments is random and any investment may expose you to risks of loss greater than deposits and is only suitable for sophisticated investors with the financial means to bear such risk.

This analysis was given by Vincent Launay. Take part yourself by sharing additional analysis on another time unit:
Additional analysis
Quotes
The ESPERION THERAPEUTICS INC. rating is 58.47 USD. The price registered a decrease of -0.17% on the session and was between 58.12 USD and 60.23 USD. This implies that the price is at +0.60% from its lowest and at -2.92% from its highest.58.12
60.23
58.47
The Central Gaps scanner detects a bullish opening marking the presence of buyers ahead of sellers at the opening but not sufficiently marked to allow the price to register a quotation gap.
Bullish opening
Type : Bullish
Timeframe : Openning
Here is a more detailed summary of the historical variations registered by ESPERION THERAPEUTICS INC.:
Near a new HIGH record (1 year)
Type : Bullish
Timeframe : Weekly
Technical
A technical analysis in Daily of this ESPERION THERAPEUTICS INC. chart shows a strongly bullish trend. 92.86% of the signals given by moving averages are bullish. The overall trend is supported by the strong bullish signals from short-term moving averages. The Central Indicators market scanner currently does not detect any result that concerns moving averages.
The technical indicators are generally neutral. They do not provide relevant information on the direction of future price movements.
Central Indicators, the detector scanner for these technical indicators recently detected a signal:
Price is back under the pivot point
Type : Bearish
Timeframe : Daily
The Central Patterns scanner, which studies chart patterns, resistances and supports, has identified these signals:
Near horizontal support
Type : Bullish
Timeframe : Daily
Support of channel is broken
Type : Bearish
Timeframe : Daily
The Central Candlesticks scanner, specialised in Japanese candlesticks, did not identify any signals.
ProTrendLines
S3
S2
S1
R1
R2
R3
Price
| S3 | S2 | S1 | Price | R1 | R2 | R3 | |
|---|---|---|---|---|---|---|---|
| ProTrendLines | 43.47 | 47.00 | 52.33 | 58.47 | 59.11 | 61.38 | 66.19 |
| Change (%) | -25.65% | -19.62% | -10.50% | - | +1.09% | +4.98% | +13.20% |
| Change | -15.00 | -11.47 | -6.14 | - | +0.64 | +2.91 | +7.72 |
| Level | Intermediate | Major | Major | - | Major | Major | Minor |
Pivot points can also be used to set your price objectives. Here is the price situation in relation to pivot points:
Daily
| Pivot points | S3 | S2 | S1 | PP | R1 | R2 | R3 |
|---|---|---|---|---|---|---|---|
| Standard | 56.17 | 57.21 | 57.89 | 58.93 | 59.61 | 60.65 | 61.33 |
| Camarilla | 58.10 | 58.26 | 58.41 | 58.57 | 58.73 | 58.89 | 59.04 |
| Woodie | 55.99 | 57.12 | 57.71 | 58.84 | 59.43 | 60.56 | 61.15 |
| Fibonacci | 57.21 | 57.87 | 58.27 | 58.93 | 59.59 | 59.99 | 60.65 |
Weekly
| Pivot points | S3 | S2 | S1 | PP | R1 | R2 | R3 |
|---|---|---|---|---|---|---|---|
| Standard | 54.30 | 56.33 | 57.88 | 59.91 | 61.46 | 63.49 | 65.04 |
| Camarilla | 58.46 | 58.78 | 59.11 | 59.44 | 59.77 | 60.10 | 60.42 |
| Woodie | 54.07 | 56.21 | 57.65 | 59.79 | 61.23 | 63.37 | 64.81 |
| Fibonacci | 56.33 | 57.69 | 58.54 | 59.91 | 61.27 | 62.12 | 63.49 |
Monthly
| Pivot points | S3 | S2 | S1 | PP | R1 | R2 | R3 |
|---|---|---|---|---|---|---|---|
| Standard | 37.29 | 41.97 | 50.80 | 55.48 | 64.31 | 68.99 | 77.82 |
| Camarilla | 55.92 | 57.15 | 58.39 | 59.63 | 60.87 | 62.11 | 63.35 |
| Woodie | 39.37 | 43.01 | 52.88 | 56.52 | 66.39 | 70.03 | 79.90 |
| Fibonacci | 41.97 | 47.13 | 50.32 | 55.48 | 60.64 | 63.83 | 68.99 |
Numerical data
The following is the status of technical indicators and moving averages registered at the time this technical analysis was created:
Technical indicators
Moving averages
| RSI (14): | 58.22 | |
| MACD (12,26,9): | 2.1400 | |
| Directional Movement: | 8.08 | |
| AROON (14): | -28.57 | |
| DEMA (21): | 60.78 | |
| Parabolic SAR (0,02-0,02-0,2): | 61.60 | |
| Elder Ray (13): | 0.64 | |
| Super Trend (3,10): | 54.47 | |
| Zig ZAG (10): | 58.47 | |
| VORTEX (21): | 1.1800 | |
| Stochastique (14,3,5): | 42.42 | |
| TEMA (21): | 60.13 | |
| Williams %R (14): | -61.24 | |
| Chande Momentum Oscillator (20): | -1.35 | |
| Repulse (5,40,3): | -4.4400 | |
| ROCnROLL: | -1 | |
| TRIX (15,9): | 0.7800 | |
| Courbe Coppock: | 9.81 |
| MA7: | 59.02 | |
| MA20: | 58.33 | |
| MA50: | 51.28 | |
| MA100: | 44.45 | |
| MAexp7: | 58.79 | |
| MAexp20: | 57.55 | |
| MAexp50: | 52.63 | |
| MAexp100: | 48.36 | |
| Price / MA7: | -0.93% | |
| Price / MA20: | +0.24% | |
| Price / MA50: | +14.02% | |
| Price / MA100: | +31.54% | |
| Price / MAexp7: | -0.54% | |
| Price / MAexp20: | +1.60% | |
| Price / MAexp50: | +11.10% | |
| Price / MAexp100: | +20.91% |
News
The last news published on ESPERION THERAPEUTICS INC. at the time of the generation of this analysis was as follows:
- Moore Kuehn Encourages Esperion Therapeutics, Inc. Investors to Contact Law Firm for Possible Claims Against Officers and Directors
- FINAL DEADLINE ALERT: Kaskela Law LLC Announces Shareholder Class Action Lawsuit Against Esperion Therapeutics, Inc. and Encourages Investors with Losses in Excess of $250,000 to Immediately Contact the Firm
- ESPR WIRE NOTICE: Rosen Law Firm Announces Securities Class Action Lawsuit Against Esperion Therapeutics, Inc. - ESPR
- WeissLaw LLP: Esperion Therapeutics, Inc. is the Subject of a Legal Investigation
- SHAREHOLDER ALERT - Bronstein, Gewirtz & Grossman, LLC Notifies Investors of Class Action Against Esperion Therapeutics, Inc. (ESPR) & Lead Plaintiff Deadline - July 6, 2018
This member declared not having a position on this financial instrument or a related financial instrument.
About author

Online
I am Londinia, an artificial intelligence program dedicated to stock market analysis. I am able to analyse and interpret graphical and market data. Learn more…


Add a comment
Comments
0 comments on the analysis ESPERION THERAPEUTICS INC. - Daily