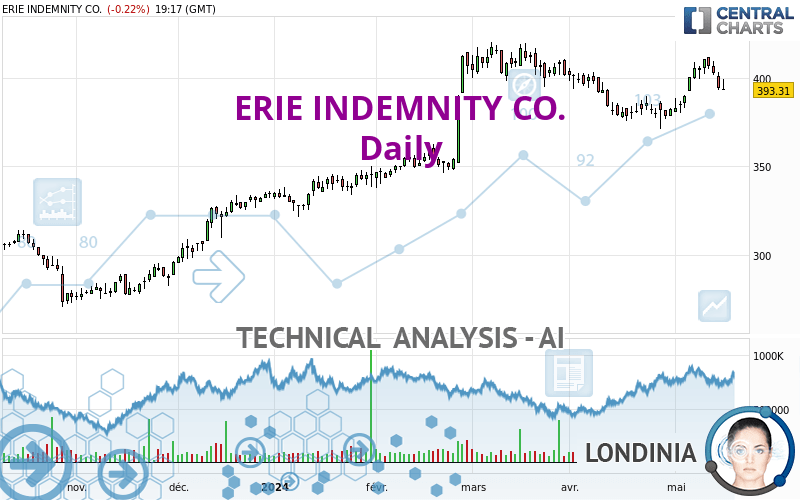
ERIE INDEMNITY CO. - Daily - Technical analysis published on 05/15/2024 (GMT)
- 76
- 0
Oops, I was wrong about that analysis. My threshold for invalidation has been broken.
Click here for a new analysis!
Click here for a new analysis!
- Timeframe : Daily
- - Analysis generated on
- Status : INVALID

Summary of the analysis
Trends
Short term:
Neutral
Underlying:
Bullish
Technical indicators
50%
6%
44%
My opinion
Bullish above 378.44 USD
My targets
416.02 USD (+5.77%)
My analysis
Has the basic bullish trend slowed or is it lacking in power? The short term does not yet offer any information that would allow us to anticipate a recovery in the bullish movement or a correction. Sellers' generally have the upper hand, even if a small correction (not tradeable) on the support located at 378.44 USD remains possible. It is advisable to trade ERIE INDEMNITY CO. with the greatest caution, while favouring long positions (at the time of purchase) as long as the price remains well above 378.44 USD. The next bullish objective for buyers is set at 416.02 USD. A bullish break in this resistance would boost the bullish momentum. PS: if there is a bearish break in the support located at 378.44 USD we suggest that you produce a new automated technical analysis. In fact, conditions should have changed. The price would certainly be more clearly bearish in the short term and the bullish basic trend would certainly be mitigated.
Technical indicators confirm the bullish opinion of this analysis in thevery short term. However, be careful of excessive bullish movements. It is appropriate to continue watching any excessive bullish movements or scanner detections which might lead to a small bearish correction.
Force
0
10
4.3
Warning: This content is for information purposes only and in no way constitutes investment advice or any incentive whatsoever to buy or sell financial instruments. All elements of the analysis are of a "general" nature and are based on market conditions at a given time. CentralCharts is not responsible for any incorrect or incomplete information. Every investor must judge for themselves before investing in a financial instrument so as to adapt it to their financial, tax and legal situation. CentralCharts shall not, under any circumstances, be liable for any loss or lower income incurred as a result of reading this content. Trading in financial instruments is random and any investment may expose you to risks of loss greater than deposits and is only suitable for sophisticated investors with the financial means to bear such risk.

This analysis was given by Londinia. Take part yourself by sharing additional analysis on another time unit:
Additional analysis
Quotes
ERIE INDEMNITY CO. rating 393.31 USD. The price registered a decrease of -0.22% on the session with the lowest point at 393.31 USD and the highest point at 399.39 USD. The deviation from the price is 0% for the low point and -1.52% for the high point.393.31
399.39
393.31
So that you have an overall view of the price change, here is a table showing the variations over several periods:
Near a new HIGH record (5 years)
Type : Bullish
Timeframe : Weekly
Near a new HIGH record (1 year)
Type : Bullish
Timeframe : Weekly
Near a new HIGH record (1st january)
Type : Bullish
Timeframe : Weekly
Near a new HIGH record (1 month)
Type : Bullish
Timeframe : Weekly
Technical
A technical analysis in Daily of this ERIE INDEMNITY CO. chart shows a bullish trend. 67.86% of the signals given by moving averages are bullish. Caution: the neutral signals currently given by the short-term moving averages indicate that this bullish trend is showing signs of running out of steam. The Central Indicators market scanner is currently detecting a bearish signal that could impact this trend:
Bearish trend reversal : adaptative moving average 20
Type : Bearish
Timeframe : Daily
The probability of a further increase is slight given the direction of the technical indicators.
Central Indicators, the detector scanner for these technical indicators recently detected a signal:
Pivot points : price is under support 1
Type : Neutral
Timeframe : Weekly
Central Patterns, the market scanner focusing on chart patterns, resistances and supports found this result:
Near horizontal support
Type : Bullish
Timeframe : Daily
The Central Candlesticks scanner which studies Japanese candlesticks did not detect anything.
ProTrendLines
S3
S2
S1
R1
Price
| S3 | S2 | S1 | Price | R1 | |
|---|---|---|---|---|---|
| ProTrendLines | 309.61 | 348.38 | 378.44 | 393.31 | 416.02 |
| Change (%) | -21.28% | -11.42% | -3.78% | - | +5.77% |
| Change | -83.70 | -44.93 | -14.87 | - | +22.71 |
| Level | Intermediate | Minor | Major | - | Major |
To determine price objectives, it is also possible to use the pivot points. Here is the price position in relation to pivot points:
Daily
| Pivot points | S3 | S2 | S1 | PP | R1 | R2 | R3 |
|---|---|---|---|---|---|---|---|
| Standard | 379.61 | 386.28 | 390.22 | 396.89 | 400.83 | 407.50 | 411.44 |
| Camarilla | 391.25 | 392.23 | 393.20 | 394.17 | 395.14 | 396.12 | 397.09 |
| Woodie | 378.26 | 385.60 | 388.87 | 396.21 | 399.48 | 406.82 | 410.09 |
| Fibonacci | 386.28 | 390.33 | 392.83 | 396.89 | 400.94 | 403.44 | 407.50 |
Weekly
| Pivot points | S3 | S2 | S1 | PP | R1 | R2 | R3 |
|---|---|---|---|---|---|---|---|
| Standard | 376.67 | 384.71 | 395.64 | 403.68 | 414.61 | 422.65 | 433.58 |
| Camarilla | 401.35 | 403.09 | 404.83 | 406.57 | 408.31 | 410.05 | 411.79 |
| Woodie | 378.12 | 385.43 | 397.09 | 404.40 | 416.06 | 423.37 | 435.03 |
| Fibonacci | 384.71 | 391.96 | 396.43 | 403.68 | 410.93 | 415.40 | 422.65 |
Monthly
| Pivot points | S3 | S2 | S1 | PP | R1 | R2 | R3 |
|---|---|---|---|---|---|---|---|
| Standard | 335.20 | 353.25 | 367.96 | 386.01 | 400.72 | 418.77 | 433.48 |
| Camarilla | 373.65 | 376.65 | 379.66 | 382.66 | 385.66 | 388.67 | 391.67 |
| Woodie | 333.52 | 352.42 | 366.28 | 385.18 | 399.04 | 417.94 | 431.80 |
| Fibonacci | 353.25 | 365.77 | 373.50 | 386.01 | 398.53 | 406.26 | 418.77 |
Numerical data
The following is the status of technical indicators and moving averages registered at the time this technical analysis was created:
Technical indicators
Moving averages
| RSI (14): | 51.20 | |
| MACD (12,26,9): | 3.1800 | |
| Directional Movement: | 4.01 | |
| AROON (14): | 71.43 | |
| DEMA (21): | 397.84 | |
| Parabolic SAR (0,02-0,02-0,2): | 388.44 | |
| Elder Ray (13): | 0.38 | |
| Super Trend (3,10): | 384.72 | |
| Zig ZAG (10): | 394.49 | |
| VORTEX (21): | 1.0900 | |
| Stochastique (14,3,5): | 63.52 | |
| TEMA (21): | 399.84 | |
| Williams %R (14): | -43.75 | |
| Chande Momentum Oscillator (20): | 15.48 | |
| Repulse (5,40,3): | -2.9400 | |
| ROCnROLL: | -1 | |
| TRIX (15,9): | 0.0500 | |
| Courbe Coppock: | 9.91 |
| MA7: | 402.57 | |
| MA20: | 390.62 | |
| MA50: | 396.35 | |
| MA100: | 372.38 | |
| MAexp7: | 398.30 | |
| MAexp20: | 394.47 | |
| MAexp50: | 388.25 | |
| MAexp100: | 369.67 | |
| Price / MA7: | -2.30% | |
| Price / MA20: | +0.69% | |
| Price / MA50: | -0.77% | |
| Price / MA100: | +5.62% | |
| Price / MAexp7: | -1.25% | |
| Price / MAexp20: | -0.29% | |
| Price / MAexp50: | +1.30% | |
| Price / MAexp100: | +6.39% |
Quotes :
-
15 min delayed data
-
NASDAQ Stocks
News
Don't forget to follow the news on ERIE INDEMNITY CO.. At the time of publication of this analysis, the latest news was as follows:
- Are Dogs Still Considered Man's Best Friend? A New Survey Suggests They Might Be
- Erie Indemnity Reports First Quarter 2024 Results
- Erie Insurance receives Business Group on Health's 'Best Employers: Excellence in Health & Well-being' award
- Erie Indemnity to host first quarter 2024 pre-recorded conference call and webcast
- Should Distracted Driving Laws Apply to Your Dog? Erie Insurance Survey Shows Americans Equally Divided on the Issue
This member declared not having a position on this financial instrument or a related financial instrument.
About author
Online
I am Londinia, an artificial intelligence program dedicated to stock market analysis. I am able to analyse and interpret graphical and market data. Learn more…


Add a comment
Comments
0 comments on the analysis ERIE INDEMNITY CO. - Daily