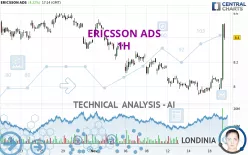
ERICSSON ADS - 1H - Technical analysis published on 11/19/2024 (GMT)
- 153
- 0
Click here for a new analysis!
- Timeframe : 1H
- - Analysis generated on
- Status : INVALID

Summary of the analysis

Additional analysis
Quotes
ERICSSON ADS rating 8.40 USD. The price has increased by +4.22% since the last closing and was between 7.97 USD and 8.52 USD. This implies that the price is at +5.40% from its lowest and at -1.41% from its highest.A study of price movements over other periods shows the following variations:
Near a new HIGH record (1 month)
Type : Bullish
Timeframe : Weekly
Technical
Technical analysis of this 1H chart of ERICSSON ADS indicates that the overall trend is not clearly defined. The trend could quickly turn bullish due to the strong bullish signals currently being given by short-term moving averages. The Central Indicators market scanner is currently detecting several bullish signals that could impact this trend:
Bullish trend reversal : Moving Average 50
Type : Bullish
Timeframe : 1 hour
Bullish trend reversal : adaptative moving average 50
Type : Bullish
Timeframe : 1 hour
Bullish trend reversal : adaptative moving average 100
Type : Bullish
Timeframe : 1 hour
In fact, according to the parameters integrated into the Central Analyzer system, 13 technical indicators out of 18 analysed are currently bullish. Central Indicators, the scanner specialised in technical indicators, has identified these signals:
Pivot points : price is over resistance 3
Type : Neutral
Timeframe : 1 hour
Pivot points : price is over resistance 3
Type : Neutral
Timeframe : Weekly
An analysis of the price chart with the Central Patterns scanner (detector of chart patterns and resistances and supports) shows several results that can have an impact on the price change:
Horizontal resistance is broken
Type : Bullish
Timeframe : 1 hour
Resistance of channel is broken
Type : Bullish
Timeframe : 1 hour
Central Candlesticks, the scanner specialised in Japanese candlesticks, detects a bearish signal that could support the hypothesis of a small drop in the very short term:
Bearish doji star
Type : Bearish
Timeframe : 1 hour
| S3 | S2 | S1 | Price | R1 | R2 | R3 | |
|---|---|---|---|---|---|---|---|
| ProTrendLines | 8.07 | 8.26 | 8.38 | 8.40 | 8.59 | 9.06 | 10.34 |
| Change (%) | -3.93% | -1.67% | -0.24% | - | +2.26% | +7.86% | +23.10% |
| Change | -0.33 | -0.14 | -0.02 | - | +0.19 | +0.66 | +1.94 |
| Level | Intermediate | Minor | Intermediate | - | Major | Intermediate | Intermediate |
Pivot points can also be used to set your price objectives. Here is the price situation in relation to pivot points:
| Pivot points | S3 | S2 | S1 | PP | R1 | R2 | R3 |
|---|---|---|---|---|---|---|---|
| Standard | 7.85 | 7.91 | 7.98 | 8.04 | 8.11 | 8.17 | 8.24 |
| Camarilla | 8.02 | 8.04 | 8.05 | 8.06 | 8.07 | 8.08 | 8.10 |
| Woodie | 7.87 | 7.91 | 8.00 | 8.04 | 8.13 | 8.17 | 8.26 |
| Fibonacci | 7.91 | 7.96 | 7.99 | 8.04 | 8.09 | 8.12 | 8.17 |
| Pivot points | S3 | S2 | S1 | PP | R1 | R2 | R3 |
|---|---|---|---|---|---|---|---|
| Standard | 7.60 | 7.76 | 7.87 | 8.03 | 8.14 | 8.30 | 8.41 |
| Camarilla | 7.90 | 7.92 | 7.95 | 7.97 | 8.00 | 8.02 | 8.04 |
| Woodie | 7.57 | 7.75 | 7.84 | 8.02 | 8.11 | 8.29 | 8.38 |
| Fibonacci | 7.76 | 7.87 | 7.93 | 8.03 | 8.14 | 8.20 | 8.30 |
| Pivot points | S3 | S2 | S1 | PP | R1 | R2 | R3 |
|---|---|---|---|---|---|---|---|
| Standard | 6.28 | 6.79 | 7.59 | 8.10 | 8.90 | 9.41 | 10.21 |
| Camarilla | 8.02 | 8.14 | 8.26 | 8.38 | 8.50 | 8.62 | 8.74 |
| Woodie | 6.42 | 6.86 | 7.73 | 8.17 | 9.04 | 9.48 | 10.35 |
| Fibonacci | 6.79 | 7.29 | 7.60 | 8.10 | 8.60 | 8.91 | 9.41 |
Numerical data
The following is the status of technical indicators and moving averages registered at the time this technical analysis was created:
| RSI (14): | 56.69 | |
| MACD (12,26,9): | 0.0000 | |
| Directional Movement: | 7.87 | |
| AROON (14): | 42.86 | |
| DEMA (21): | 8.03 | |
| Parabolic SAR (0,02-0,02-0,2): | 7.97 | |
| Elder Ray (13): | 0.03 | |
| Super Trend (3,10): | 7.94 | |
| Zig ZAG (10): | 8.09 | |
| VORTEX (21): | 0.9800 | |
| Stochastique (14,3,5): | 73.02 | |
| TEMA (21): | 8.06 | |
| Williams %R (14): | -3.33 | |
| Chande Momentum Oscillator (20): | 0.12 | |
| Repulse (5,40,3): | 1.5900 | |
| ROCnROLL: | 1 | |
| TRIX (15,9): | -0.0200 | |
| Courbe Coppock: | 1.68 |
| MA7: | 8.05 | |
| MA20: | 8.28 | |
| MA50: | 7.88 | |
| MA100: | 7.30 | |
| MAexp7: | 8.05 | |
| MAexp20: | 8.03 | |
| MAexp50: | 8.07 | |
| MAexp100: | 8.13 | |
| Price / MA7: | +4.35% | |
| Price / MA20: | +1.45% | |
| Price / MA50: | +6.60% | |
| Price / MA100: | +15.07% | |
| Price / MAexp7: | +4.35% | |
| Price / MAexp20: | +4.61% | |
| Price / MAexp50: | +4.09% | |
| Price / MAexp100: | +3.32% |
News
The latest news and videos published on ERICSSON ADS at the time of the analysis were as follows:
- FPT and Ericsson Join Forces to Propel 5G-Driven AI, Data, and Digital Transformation
- Invitation to media and analyst briefing for Ericsson Q3 2024 report
- Ericsson and INFORM to Strengthen Financial Services Security and Combat Advanced Fraud
- Cradlepoint Enhances Wyoming Highway Patrol Vehicle Connectivity with Cellular-to-Satellite Failover
- Ericsson, NRTC, Southern Linc and Anterix ink landmark agreements to deliver connectivity for rural electric cooperatives across the U.S.
About author
Online


Add a comment
Comments
0 comments on the analysis ERICSSON ADS - 1H