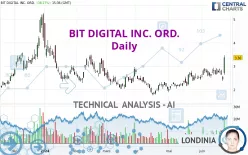
BIT DIGITAL INC. ORD. - Daily - Technical analysis published on 06/25/2024 (GMT)
- 110
- 0
Click here for a new analysis!
- Timeframe : Daily
- - Analysis generated on
- Status : TARGET REACHED

Summary of the analysis

Additional analysis
Quotes
The BIT DIGITAL INC. ORD. price is 3.36 USD. On the day, this instrument gained +38.27% with the lowest point at 2.64 USD and the highest point at 3.47 USD. The deviation from the price is +27.27% for the low point and -3.17% for the high point.A bullish gap was detected at the opening by the Central Gaps scanner. There are a lot of buyers and they have the upper hand in the very short term.
Opening Gap UP
Type : Bullish
Timeframe : Openning
So that you have an overall view of the price change, here is a table showing the variations over several periods:
Technical
Technical analysis of BIT DIGITAL INC. ORD. in Daily shows an overall slightly bullish trend. Only 53.57% of the signals given by moving averages are bullish. This slightly bullish trend is not supported by the signals currently being given by short-term moving averages. An assessment of moving averages reveals several bullish signals that could impact this trend:
Bullish price crossover with Moving Average 20
Type : Bullish
Timeframe : Daily
Bullish price crossover with Moving Average 100
Type : Bullish
Timeframe : Daily
Bullish price crossover with adaptative moving average 20
Type : Bullish
Timeframe : Daily
Bullish price crossover with adaptative moving average 50
Type : Bullish
Timeframe : Daily
Bullish price crossover with adaptative moving average 100
Type : Bullish
Timeframe : Daily
In fact, of the 18 technical indicators analysed by Central Analyzer, 6 are bullish, 4 are neutral and 8 are bearish. Caution: the Central Indicators scanner currently detects an excess:
CCI indicator is overbought : over 100
Type : Neutral
Timeframe : Daily
Williams %R indicator is overbought : over -20
Type : Neutral
Timeframe : Daily
Pivot points : price is over resistance 2
Type : Neutral
Timeframe : Weekly
Pivot points : price is over resistance 3
Type : Neutral
Timeframe : Daily
RSI indicator is back over 50
Type : Bullish
Timeframe : Daily
Parabolic SAR indicator bullish reversal
Type : Bullish
Timeframe : Daily
Aroon indicator bullish trend
Type : Bullish
Timeframe : Daily
Momentum indicator is back over 0
Type : Bullish
Timeframe : Daily
An analysis of the price chart with the Central Patterns scanner (detector of chart patterns and resistances and supports) shows a result that can have an impact on the price change:
Near resistance of triangle
Type : Bearish
Timeframe : Daily
The presence of these bullish Japanese candlestick patterns detected by Central Candlesticks that could cause a very short term rebound were also noted:
White morning star
Type : Bullish
Timeframe : Daily
Abandoned baby morning star
Type : Bullish
Timeframe : Daily
| S3 | S2 | S1 | Price | R1 | R2 | R3 | |
|---|---|---|---|---|---|---|---|
| ProTrendLines | 2.31 | 2.81 | 3.14 | 3.36 | 3.55 | 4.41 | 5.09 |
| Change (%) | -31.25% | -16.37% | -6.55% | - | +5.65% | +31.25% | +51.49% |
| Change | -1.05 | -0.55 | -0.22 | - | +0.19 | +1.05 | +1.73 |
| Level | Major | Intermediate | Minor | - | Minor | Minor | Major |
Pivot points can also be used to set your price objectives. Here is the price situation in relation to pivot points:
| Pivot points | S3 | S2 | S1 | PP | R1 | R2 | R3 |
|---|---|---|---|---|---|---|---|
| Standard | 2.13 | 2.25 | 2.34 | 2.46 | 2.55 | 2.67 | 2.76 |
| Camarilla | 2.37 | 2.39 | 2.41 | 2.43 | 2.45 | 2.47 | 2.49 |
| Woodie | 2.12 | 2.24 | 2.33 | 2.45 | 2.54 | 2.66 | 2.75 |
| Fibonacci | 2.25 | 2.33 | 2.38 | 2.46 | 2.54 | 2.59 | 2.67 |
| Pivot points | S3 | S2 | S1 | PP | R1 | R2 | R3 |
|---|---|---|---|---|---|---|---|
| Standard | 2.25 | 2.44 | 2.54 | 2.73 | 2.83 | 3.02 | 3.12 |
| Camarilla | 2.56 | 2.59 | 2.61 | 2.64 | 2.67 | 2.69 | 2.72 |
| Woodie | 2.21 | 2.42 | 2.50 | 2.71 | 2.79 | 3.00 | 3.08 |
| Fibonacci | 2.44 | 2.55 | 2.62 | 2.73 | 2.84 | 2.91 | 3.02 |
| Pivot points | S3 | S2 | S1 | PP | R1 | R2 | R3 |
|---|---|---|---|---|---|---|---|
| Standard | 1.06 | 1.47 | 1.98 | 2.39 | 2.90 | 3.31 | 3.82 |
| Camarilla | 2.23 | 2.31 | 2.40 | 2.48 | 2.56 | 2.65 | 2.73 |
| Woodie | 1.10 | 1.50 | 2.02 | 2.42 | 2.94 | 3.34 | 3.86 |
| Fibonacci | 1.47 | 1.83 | 2.04 | 2.39 | 2.75 | 2.96 | 3.31 |
Numerical data
The following is the status of the technical indicators and moving averages at the time of publication of this technical analysis:
| RSI (14): | 44.31 | |
| MACD (12,26,9): | 0.0700 | |
| Directional Movement: | -3.52 | |
| AROON (14): | -42.86 | |
| DEMA (21): | 2.75 | |
| Parabolic SAR (0,02-0,02-0,2): | 2.94 | |
| Elder Ray (13): | -0.20 | |
| Super Trend (3,10): | 2.17 | |
| Zig ZAG (10): | 2.43 | |
| VORTEX (21): | 0.9200 | |
| Stochastique (14,3,5): | 42.92 | |
| TEMA (21): | 2.75 | |
| Williams %R (14): | -89.47 | |
| Chande Momentum Oscillator (20): | -0.38 | |
| Repulse (5,40,3): | -9.1100 | |
| ROCnROLL: | 2 | |
| TRIX (15,9): | 0.6500 | |
| Courbe Coppock: | 9.28 |
| MA7: | 2.72 | |
| MA20: | 2.66 | |
| MA50: | 2.38 | |
| MA100: | 2.48 | |
| MAexp7: | 2.67 | |
| MAexp20: | 2.64 | |
| MAexp50: | 2.53 | |
| MAexp100: | 2.55 | |
| Price / MA7: | +23.53% | |
| Price / MA20: | +26.32% | |
| Price / MA50: | +41.18% | |
| Price / MA100: | +35.48% | |
| Price / MAexp7: | +25.84% | |
| Price / MAexp20: | +27.27% | |
| Price / MAexp50: | +32.81% | |
| Price / MAexp100: | +31.76% |
About author

Online


Add a comment
Comments
0 comments on the analysis BIT DIGITAL INC. ORD. - Daily