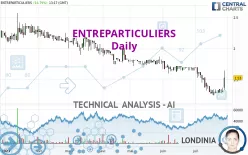
ENTREPARTICULIERS - Daily - Technical analysis published on 07/28/2023 (GMT)
- 216
- 0
Click here for a new analysis!
- Timeframe : Daily
- - Analysis generated on
- Status : TARGET REACHED

Summary of the analysis

Additional analysis
Quotes
The ENTREPARTICULIERS price is 1.530 EUR. On the day, this instrument gained +16.79% and was between 1.335 EUR and 1.650 EUR. This implies that the price is at +14.61% from its lowest and at -7.27% from its highest.The Central Gaps scanner detects a bullish gap which is a sign that buyers have taken the lead in the very short term.
Opening Gap UP
Type : Bullish
Timeframe : Openning
A study of price movements over other periods shows the following variations:
Technical
Technical analysis of this Daily chart of ENTREPARTICULIERS indicates that the overall trend is bearish. 67.86% of the signals given by moving averages are bearish. Caution: as the signals currently given by short-term moving averages are rather neutral, the bearish trend could slow down. The Central Indicators scanner detects bullish signals on moving averages that could impact this trend:
Bullish price crossover with Moving Average 20
Type : Bullish
Timeframe : Daily
Bullish price crossover with Moving Average 50
Type : Bullish
Timeframe : Daily
Bullish price crossover with adaptative moving average 20
Type : Bullish
Timeframe : Daily
Bullish price crossover with adaptative moving average 50
Type : Bullish
Timeframe : Daily
The probability of a further increase are moderate given the direction of the technical indicators.
But beware of excesses. The Central Indicators scanner currently detects this:
Williams %R indicator is overbought : over -20
Type : Neutral
Timeframe : Daily
Pivot points : price is over resistance 3
Type : Neutral
Timeframe : Daily
Pivot points : price is over resistance 3
Type : Neutral
Timeframe : Weekly
RSI indicator is back over 50
Type : Bullish
Timeframe : Daily
Aroon indicator bullish trend
Type : Bullish
Timeframe : Daily
SuperTrend indicator bullish reversal
Type : Bullish
Timeframe : Daily
Momentum indicator is back over 0
Type : Bullish
Timeframe : Daily
Central Patterns, the market scanner focusing on chart patterns, resistances and supports found this result:
Resistance of channel is broken
Type : Bullish
Timeframe : Daily
The presence of a bullish Japanese candlestick pattern detected by Central Candlesticks that could cause a very short term rebound was also detected:
Long white line
Type : Bullish
Timeframe : Daily
| S1 | Price | R1 | R2 | R3 | |
|---|---|---|---|---|---|
| ProTrendLines | 1.275 | 1.530 | 1.820 | 2.126 | 2.361 |
| Change (%) | -16.67% | - | +18.95% | +38.95% | +54.31% |
| Change | -0.255 | - | +0.290 | +0.596 | +0.831 |
| Level | Intermediate | - | Minor | Minor | Intermediate |
To determine price objectives, it is also possible to use the pivot points. Here is the price position in relation to pivot points:
| Pivot points | S3 | S2 | S1 | PP | R1 | R2 | R3 |
|---|---|---|---|---|---|---|---|
| Standard | 1.213 | 1.257 | 1.283 | 1.327 | 1.353 | 1.397 | 1.423 |
| Camarilla | 1.291 | 1.297 | 1.304 | 1.310 | 1.316 | 1.323 | 1.329 |
| Woodie | 1.205 | 1.253 | 1.275 | 1.323 | 1.345 | 1.393 | 1.415 |
| Fibonacci | 1.257 | 1.283 | 1.300 | 1.327 | 1.353 | 1.370 | 1.397 |
| Pivot points | S3 | S2 | S1 | PP | R1 | R2 | R3 |
|---|---|---|---|---|---|---|---|
| Standard | 1.153 | 1.202 | 1.248 | 1.297 | 1.343 | 1.392 | 1.438 |
| Camarilla | 1.269 | 1.278 | 1.286 | 1.295 | 1.304 | 1.312 | 1.321 |
| Woodie | 1.153 | 1.201 | 1.248 | 1.296 | 1.343 | 1.391 | 1.438 |
| Fibonacci | 1.202 | 1.238 | 1.260 | 1.297 | 1.333 | 1.355 | 1.392 |
| Pivot points | S3 | S2 | S1 | PP | R1 | R2 | R3 |
|---|---|---|---|---|---|---|---|
| Standard | 1.397 | 1.498 | 1.597 | 1.698 | 1.797 | 1.898 | 1.997 |
| Camarilla | 1.640 | 1.658 | 1.677 | 1.695 | 1.713 | 1.732 | 1.750 |
| Woodie | 1.395 | 1.498 | 1.595 | 1.698 | 1.795 | 1.898 | 1.995 |
| Fibonacci | 1.498 | 1.575 | 1.622 | 1.698 | 1.775 | 1.822 | 1.898 |
Numerical data
The following is the status of technical indicators and moving averages registered at the time this technical analysis was created:
| RSI (14): | 62.81 | |
| MACD (12,26,9): | -0.0710 | |
| Directional Movement: | 10.075 | |
| AROON (14): | 50.000 | |
| DEMA (21): | 1.323 | |
| Parabolic SAR (0,02-0,02-0,2): | 1.252 | |
| Elder Ray (13): | 0.099 | |
| Super Trend (3,10): | 1.209 | |
| Zig ZAG (10): | 1.625 | |
| VORTEX (21): | 0.8110 | |
| Stochastique (14,3,5): | 44.90 | |
| TEMA (21): | 1.328 | |
| Williams %R (14): | 0.00 | |
| Chande Momentum Oscillator (20): | 0.255 | |
| Repulse (5,40,3): | 20.1900 | |
| ROCnROLL: | 1 | |
| TRIX (15,9): | -0.8930 | |
| Courbe Coppock: | 22.00 |
| MA7: | 1.351 | |
| MA20: | 1.417 | |
| MA50: | 1.605 | |
| MA100: | 1.766 | |
| MAexp7: | 1.396 | |
| MAexp20: | 1.427 | |
| MAexp50: | 1.569 | |
| MAexp100: | 1.735 | |
| Price / MA7: | +13.25% | |
| Price / MA20: | +7.97% | |
| Price / MA50: | -4.67% | |
| Price / MA100: | -13.36% | |
| Price / MAexp7: | +9.60% | |
| Price / MAexp20: | +7.22% | |
| Price / MAexp50: | -2.49% | |
| Price / MAexp100: | -11.82% |
About author
Online


Add a comment
Comments
0 comments on the analysis ENTREPARTICULIERS - Daily