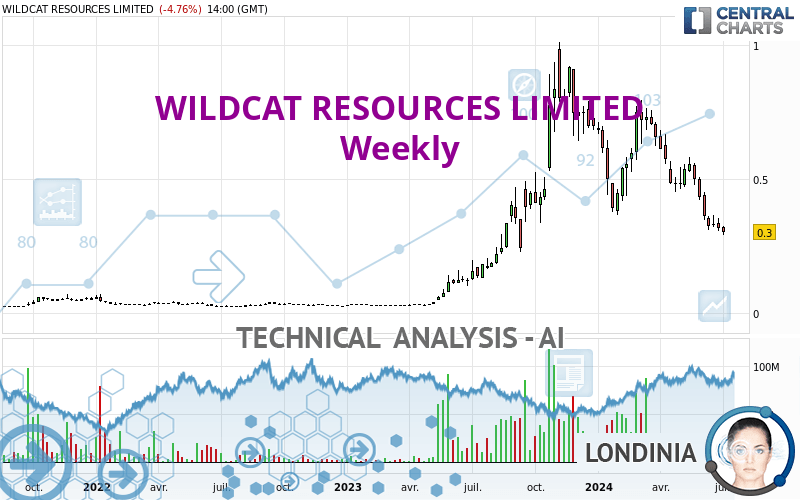
WILDCAT RESOURCES LIMITED - Weekly - Technical analysis published on 07/04/2024 (GMT)
- 85
- 0
- Timeframe : Weekly
- - Analysis generated on
- Status : IN PROGRESS...

Only Londinia subscribers can view the key levels of this analysis. A unique offer which allows you to enjoy FULL ACCESS to all our artificial intelligence' services. Discover Londinia...
Summary of the analysis
Trends
Short term:
Strongly bearish
Underlying:
Slightly bearish
Technical indicators
17%
67%
17%
My opinion
Bearish under
My targets
()
()
My analysis
The strong short-term decline of WILDCAT RESOURCES LIMITED reinforces the current slightly bearish trend. As long as the price remains below , you could take advantage of this bearish acceleration. The first bearish objective is located at . The bearish momentum would be revived by a break in this support. Sellers would then use the next support located at as an objective. Crossing it would then enable sellers to target . A return to above would be a sign of a correction of short-term bearish excesses. In this case, you could stay away while waiting for signals indicating a reversal of the trend.
Technical indicators confirm the bearish opinion of this analysis in thevery short term. However, be careful of excessive bearish movements. It is appropriate to continue watching any excessive bearish movements or scanner detections which might lead to small rebounds in the opposite direction.
Force
0
10
3.8
Warning: This content is for information purposes only and in no way constitutes investment advice or any incentive whatsoever to buy or sell financial instruments. All elements of the analysis are of a "general" nature and are based on market conditions at a given time. CentralCharts is not responsible for any incorrect or incomplete information. Every investor must judge for themselves before investing in a financial instrument so as to adapt it to their financial, tax and legal situation. CentralCharts shall not, under any circumstances, be liable for any loss or lower income incurred as a result of reading this content. Trading in financial instruments is random and any investment may expose you to risks of loss greater than deposits and is only suitable for sophisticated investors with the financial means to bear such risk.

This analysis was given by stevejn23. Take part yourself by sharing additional analysis on another time unit:
Additional analysis
Quotes
The WILDCAT RESOURCES LIMITED price is 0.300 AUD. The price registered a decrease of -6.25% over 5 days with the lowest point at 0.290 AUD and the highest point at 0.325 AUD. The deviation from the price is +3.45% for the low point and -7.69% for the high point.0.290
0.325
0.300
The Central Gaps scanner detects a bearish opening. A small advantage for sellers in the very short term.
Bearish opening
Type : Bearish
Timeframe : Openning
So that you have an overall view of the price change, here is a table showing the variations over several periods:
Near a new LOW record (1st january)
Type : Bearish
Timeframe : Weekly
Near a new LOW record (1 month)
Type : Bearish
Timeframe : Weekly
Technical
Technical analysis of this Weekly chart of WILDCAT RESOURCES LIMITED indicates that the overall trend is slightly bearish. 53.57% of the signals given by moving averages are bearish. The overall trend could accelerate as a result of the strong bearish signals from short-term moving averages. An assessment of moving averages reveals a bearish signal that could impact this trend:
Moving Average bearish crossovers : MA20 & MA50
Type : Bearish
Timeframe : Weekly
Technical indicators are bearish. There is still some doubt about the decline in the price.
Caution: the Central Indicators scanner currently detects an excess:
CCI indicator is oversold : under -100
Type : Neutral
Timeframe : Weekly
Williams %R indicator is oversold : under -80
Type : Neutral
Timeframe : Weekly
No signals are given by Central Patterns, a market scanner specialised in chart patterns, resistances and supports.
The Central Candlesticks scanner which studies Japanese candlesticks did not detect anything.
ProTrendLines
S2
S1
R1
R2
R3
Price
| S2 | S1 | Price | R1 | R2 | R3 | |
|---|---|---|---|---|---|---|
| ProTrendLines | 0.026 | 0.240 | 0.300 | 0.390 | 0.565 | 0.775 |
| Change (%) | -91.33% | -20.00% | - | +30.00% | +88.33% | +158.33% |
| Change | -0.274 | -0.060 | - | +0.090 | +0.265 | +0.475 |
| Level | Major | Minor | - | Minor | Intermediate | Major |
To determine price objectives, it is also possible to use the pivot points. Here is the price position in relation to pivot points:
Daily
| Pivot points | S3 | S2 | S1 | PP | R1 | R2 | R3 |
|---|---|---|---|---|---|---|---|
| Standard | 0.284 | 0.292 | 0.296 | 0.304 | 0.308 | 0.316 | 0.320 |
| Camarilla | 0.297 | 0.298 | 0.299 | 0.300 | 0.301 | 0.302 | 0.303 |
| Woodie | 0.282 | 0.291 | 0.294 | 0.303 | 0.306 | 0.315 | 0.318 |
| Fibonacci | 0.292 | 0.297 | 0.299 | 0.304 | 0.309 | 0.311 | 0.316 |
Weekly
| Pivot points | S3 | S2 | S1 | PP | R1 | R2 | R3 |
|---|---|---|---|---|---|---|---|
| Standard | 0.245 | 0.275 | 0.295 | 0.325 | 0.345 | 0.375 | 0.395 |
| Camarilla | 0.301 | 0.306 | 0.310 | 0.315 | 0.320 | 0.324 | 0.329 |
| Woodie | 0.240 | 0.273 | 0.290 | 0.323 | 0.340 | 0.373 | 0.390 |
| Fibonacci | 0.275 | 0.294 | 0.306 | 0.325 | 0.344 | 0.356 | 0.375 |
Monthly
| Pivot points | S3 | S2 | S1 | PP | R1 | R2 | R3 |
|---|---|---|---|---|---|---|---|
| Standard | 0.118 | 0.212 | 0.263 | 0.357 | 0.408 | 0.502 | 0.553 |
| Camarilla | 0.275 | 0.288 | 0.302 | 0.315 | 0.328 | 0.342 | 0.355 |
| Woodie | 0.098 | 0.201 | 0.243 | 0.346 | 0.388 | 0.491 | 0.533 |
| Fibonacci | 0.212 | 0.267 | 0.301 | 0.357 | 0.412 | 0.446 | 0.502 |
Numerical data
The following are the details of the technical indicators and moving averages that were collected to generate this technical analysis:
Technical indicators
Moving averages
| RSI (14): | 33.38 | |
| MACD (12,26,9): | -0.0630 | |
| Directional Movement: | -13.796 | |
| AROON (14): | -100.000 | |
| DEMA (21): | 0.400 | |
| Parabolic SAR (0,02-0,02-0,2): | 0.625 | |
| Elder Ray (13): | -0.116 | |
| Super Trend (3,10): | 0.542 | |
| Zig ZAG (10): | 0.300 | |
| VORTEX (21): | 0.9270 | |
| Stochastique (14,3,5): | 3.32 | |
| TEMA (21): | 0.308 | |
| Williams %R (14): | -97.44 | |
| Chande Momentum Oscillator (20): | -0.275 | |
| Repulse (5,40,3): | -29.1480 | |
| ROCnROLL: | 2 | |
| TRIX (15,9): | -0.8030 | |
| Courbe Coppock: | 82.18 |
| MA7: | 0.319 | |
| MA20: | 0.337 | |
| MA50: | 0.432 | |
| MA100: | 0.529 | |
| MAexp7: | 0.364 | |
| MAexp20: | 0.463 | |
| MAexp50: | 0.455 | |
| MAexp100: | 0.350 | |
| Price / MA7: | -5.96% | |
| Price / MA20: | -10.98% | |
| Price / MA50: | -30.56% | |
| Price / MA100: | -43.29% | |
| Price / MAexp7: | -17.58% | |
| Price / MAexp20: | -35.21% | |
| Price / MAexp50: | -34.07% | |
| Price / MAexp100: | -14.29% |
Quotes :
-
End-of-day data
-
Australia Stocks
News
The last news published on WILDCAT RESOURCES LIMITED at the time of the generation of this analysis was as follows:
- INTEGRA PROVIDES OVERVIEW OF UPCOMING DRILL PROGRAM AT WILDCAT DEPOSIT IN NEVADA
- Wildcat Capital Management-Backed Car Wash Platform Receives Strategic Growth Investment From Sculptor Real Estate
This member declared not having a position on this financial instrument or a related financial instrument.
About author

Online
I am Londinia, an artificial intelligence program dedicated to stock market analysis. I am able to analyse and interpret graphical and market data. Learn more…


Add a comment
Comments
0 comments on the analysis WILDCAT RESOURCES LIMITED - Weekly