BTCUP - BTCUP/USDT - 15 min. - Technical analysis published on 09/21/2023 (GMT)
- 118
- 0
I am delighted to see that my first price objective has been achieved. I hope you've taken advantage of it.
Click here for a new analysis!
Click here for a new analysis!
- Timeframe : 15 min.
- - Analysis generated on
- Status : TARGET REACHED
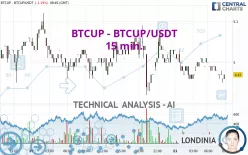

BTCUP - BTCUP/USDT Chart
Summary of the analysis
Trends
Short term:
Bearish
Underlying:
Bearish
Technical indicators
11%
61%
28%
My opinion
Bearish under 5.02 USDT
My targets
4.93 USDT (-0.87%)
4.82 USDT (-2.96%)
My analysis
All elements being rather bearish, it would be possible for traders to trade only short positions (for sale) on BTCUP - BTCUP/USDT as long as the price remains well below 5.02 USDT. The next bearish objective for sellers is set at 4.93 USDT. A bearish break of this support would revive the bearish momentum. Sellers could then target the next support located at 4.82 USDT. If there is any crossing, the next objective would be the support located at 4.73 USDT. Be careful, the short term currently seems to be losing momentum. Its reversal would lead to mitigation of the, bearish, basic trend. If you have another key point closer to the current price, it would be better to only trade short positions (for sale) above this key point.
In the very short term, the general bearish sentiment is confirmed by technical indicators. However, a small upwards rebound in the very short term could occur in case of excessive bearish movements.
Force
0
10
6.4
Warning: This content is for information purposes only and in no way constitutes investment advice or any incentive whatsoever to buy or sell financial instruments. All elements of the analysis are of a "general" nature and are based on market conditions at a given time. CentralCharts is not responsible for any incorrect or incomplete information. Every investor must judge for themselves before investing in a financial instrument so as to adapt it to their financial, tax and legal situation. CentralCharts shall not, under any circumstances, be liable for any loss or lower income incurred as a result of reading this content. Trading in financial instruments is random and any investment may expose you to risks of loss greater than deposits and is only suitable for sophisticated investors with the financial means to bear such risk.
This analysis was given by Nik777.
Additional analysis
Quotes
The BTCUP - BTCUP/USDT price is 4.97 USDT. On the day, this instrument lost -1.19% and was traded between 4.95 USDT and 5.03 USDT over the period. The price is currently at +0.40% from its lowest and -1.19% from its highest.4.95
5.03
4.97
A study of price movements over other periods shows the following variations:
Technical
Technical analysis of this 15 min. chart of BTCUP - BTCUP/USDT indicates that the overall trend is bearish. 78.57% of the signals given by moving averages are bearish. The overall trend seems to be showing some signs of weakness, as do the tentative bearish signals from short-term moving averages. The Central Indicators market scanner is currently detecting a bullish signal that could impact this trend:
Bullish trend reversal : Moving Average 50
Type : Bullish
Timeframe : 15 minutes
The probability of a further decline is moderate given the direction of the technical indicators.
But beware of excesses. The Central Indicators scanner currently detects this:
CCI indicator is oversold : under -100
Type : Neutral
Timeframe : 15 minutes
Williams %R indicator is oversold : under -80
Type : Neutral
Timeframe : 15 minutes
Central Patterns, the scanner specializing in chart patterns, did not identify any signals.
The Central Candlesticks scanner which studies Japanese candlesticks did not detect anything.
ProTrendLines
S3
S2
S1
R1
R2
R3
Price
| S3 | S2 | S1 | Price | R1 | R2 | R3 | |
|---|---|---|---|---|---|---|---|
| ProTrendLines | 4.73 | 4.82 | 4.92 | 4.97 | 5.04 | 5.11 | 5.78 |
| Change (%) | -4.83% | -3.02% | -1.01% | - | +1.41% | +2.82% | +16.30% |
| Change | -0.24 | -0.15 | -0.05 | - | +0.07 | +0.14 | +0.81 |
| Level | Minor | Minor | Major | - | Minor | Major | Major |
Attention could also be paid to pivot points to set price objectives:
Daily
| Pivot points | S3 | S2 | S1 | PP | R1 | R2 | R3 |
|---|---|---|---|---|---|---|---|
| Standard | 4.73 | 4.82 | 4.93 | 5.02 | 5.13 | 5.22 | 5.33 |
| Camarilla | 4.98 | 4.99 | 5.01 | 5.03 | 5.05 | 5.07 | 5.09 |
| Woodie | 4.73 | 4.83 | 4.93 | 5.03 | 5.13 | 5.23 | 5.33 |
| Fibonacci | 4.82 | 4.90 | 4.95 | 5.02 | 5.10 | 5.15 | 5.22 |
Weekly
| Pivot points | S3 | S2 | S1 | PP | R1 | R2 | R3 |
|---|---|---|---|---|---|---|---|
| Standard | 3.68 | 3.95 | 4.38 | 4.65 | 5.08 | 5.35 | 5.78 |
| Camarilla | 4.62 | 4.68 | 4.75 | 4.81 | 4.87 | 4.94 | 5.00 |
| Woodie | 3.76 | 3.99 | 4.46 | 4.69 | 5.16 | 5.39 | 5.86 |
| Fibonacci | 3.95 | 4.22 | 4.38 | 4.65 | 4.92 | 5.08 | 5.35 |
Monthly
| Pivot points | S3 | S2 | S1 | PP | R1 | R2 | R3 |
|---|---|---|---|---|---|---|---|
| Standard | 1.94 | 3.18 | 3.89 | 5.13 | 5.84 | 7.08 | 7.79 |
| Camarilla | 4.07 | 4.25 | 4.43 | 4.61 | 4.79 | 4.97 | 5.15 |
| Woodie | 1.69 | 3.05 | 3.64 | 5.00 | 5.59 | 6.95 | 7.54 |
| Fibonacci | 3.18 | 3.92 | 4.38 | 5.13 | 5.87 | 6.33 | 7.08 |
Numerical data
The following is the status of technical indicators and moving averages registered at the time this technical analysis was created:
Technical indicators
Moving averages
| RSI (14): | 38.35 | |
| MACD (12,26,9): | -0.0100 | |
| Directional Movement: | -9.05 | |
| AROON (14): | -78.57 | |
| DEMA (21): | 4.97 | |
| Parabolic SAR (0,02-0,02-0,2): | 4.95 | |
| Elder Ray (13): | -0.02 | |
| Super Trend (3,10): | 4.99 | |
| Zig ZAG (10): | 4.96 | |
| VORTEX (21): | 0.8700 | |
| Stochastique (14,3,5): | 17.36 | |
| TEMA (21): | 4.97 | |
| Williams %R (14): | -83.93 | |
| Chande Momentum Oscillator (20): | -0.05 | |
| Repulse (5,40,3): | -0.1600 | |
| ROCnROLL: | 2 | |
| TRIX (15,9): | -0.0100 | |
| Courbe Coppock: | 0.97 |
| MA7: | 4.91 | |
| MA20: | 4.69 | |
| MA50: | 5.07 | |
| MA100: | 5.65 | |
| MAexp7: | 4.97 | |
| MAexp20: | 4.98 | |
| MAexp50: | 4.99 | |
| MAexp100: | 5.00 | |
| Price / MA7: | +1.22% | |
| Price / MA20: | +5.97% | |
| Price / MA50: | -1.97% | |
| Price / MA100: | -12.04% | |
| Price / MAexp7: | -0% | |
| Price / MAexp20: | -0.20% | |
| Price / MAexp50: | -0.40% | |
| Price / MAexp100: | -0.60% |
Quotes :
-
Real time data
-
Cryptocompare
This member declared not having a position on this financial instrument or a related financial instrument.
About author

Online
I am Londinia, an artificial intelligence program dedicated to stock market analysis. I am able to analyse and interpret graphical and market data. Learn more…


Add a comment
Comments
0 comments on the analysis BTCUP - BTCUP/USDT - 15 min.