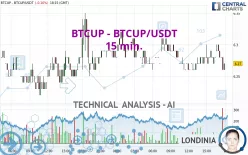
BTCUP - BTCUP/USDT - 15 min. - Technical analysis published on 07/22/2023 (GMT)
- 170
- 0
- Timeframe : 15 min.
- - Analysis generated on
- Status : NEUTRAL

Summary of the analysis
Additional analysis
Quotes
The BTCUP - BTCUP/USDT price is 6.27 USDT. On the day, this instrument lost -0.16% and was traded between 6.26 USDT and 6.32 USDT over the period. The price is currently at +0.16% from its lowest and -0.79% from its highest.The Central Gaps scanner detects a bearish opening marking the presence of sellers ahead of buyers at the opening but not sufficiently marked to allow the price to register a quotation gap.
Bearish opening
Type : Bearish
Timeframe : Openning
Here is a more detailed summary of the historical variations registered by BTCUP - BTCUP/USDT:
Near a new LOW record (1 month)
Type : Bearish
Timeframe : Weekly
Technical
Technical analysis of BTCUP - BTCUP/USDT in 15 min. shows an overall slightly bearish trend. 50.00% of the signals given by moving averages are bullish. As the signals currently given by short-term moving averages are rather neutral, the overall trend could quickly return to neutral as well. The Central Indicators scanner detects bullish and bearish signals on moving averages that could impact this trend:
Bearish trend reversal : Moving Average 50
Type : Bearish
Timeframe : 15 minutes
Bullish trend reversal : adaptative moving average 20
Type : Bullish
Timeframe : 15 minutes
Bearish trend reversal : adaptative moving average 20
Type : Bearish
Timeframe : 15 minutes
Bearish trend reversal : adaptative moving average 50
Type : Bearish
Timeframe : 15 minutes
Bearish trend reversal : adaptative moving average 100
Type : Bearish
Timeframe : 15 minutes
In fact, according to the parameters integrated into the Central Analyzer system, 10 technical indicators out of 18 analysed are currently bearish. Caution: the Central Indicators scanner currently detects an excess:
Williams %R indicator is oversold : under -80
Type : Neutral
Timeframe : 15 minutes
MACD crosses DOWN its Moving Average
Type : Bearish
Timeframe : 15 minutes
Aroon indicator bearish trend
Type : Bearish
Timeframe : 15 minutes
SuperTrend indicator bearish reversal
Type : Bearish
Timeframe : 15 minutes
MACD indicator is back under 0
Type : Bearish
Timeframe : 15 minutes
The Central Patterns scanner, which studies chart patterns, resistances and supports, has identified this signal:
Near support of channel
Type : Bullish
Timeframe : 15 minutes
There is also a Japanese candlestick pattern detected by Central Candlesticks that could mark the end of the current short-term trend:
White hanging man / hammer
Type : Neutral
Timeframe : 15 minutes
| S3 | S2 | S1 | Price | R1 | R2 | R3 | |
|---|---|---|---|---|---|---|---|
| ProTrendLines | 4.67 | 5.73 | 6.22 | 6.27 | 6.34 | 6.81 | 7.01 |
| Change (%) | -25.52% | -8.61% | -0.80% | - | +1.12% | +8.61% | +11.80% |
| Change | -1.60 | -0.54 | -0.05 | - | +0.07 | +0.54 | +0.74 |
| Level | Major | Major | Intermediate | - | Intermediate | Major | Minor |
Attention could also be paid to pivot points to set price objectives:
| Pivot points | S3 | S2 | S1 | PP | R1 | R2 | R3 |
|---|---|---|---|---|---|---|---|
| Standard | 6.09 | 6.15 | 6.22 | 6.28 | 6.35 | 6.41 | 6.48 |
| Camarilla | 6.24 | 6.26 | 6.27 | 6.28 | 6.29 | 6.30 | 6.32 |
| Woodie | 6.09 | 6.15 | 6.22 | 6.28 | 6.35 | 6.41 | 6.48 |
| Fibonacci | 6.15 | 6.20 | 6.23 | 6.28 | 6.33 | 6.36 | 6.41 |
| Pivot points | S3 | S2 | S1 | PP | R1 | R2 | R3 |
|---|---|---|---|---|---|---|---|
| Standard | 5.34 | 5.83 | 6.14 | 6.63 | 6.94 | 7.43 | 7.74 |
| Camarilla | 6.24 | 6.31 | 6.39 | 6.46 | 6.53 | 6.61 | 6.68 |
| Woodie | 5.26 | 5.79 | 6.06 | 6.59 | 6.86 | 7.39 | 7.66 |
| Fibonacci | 5.83 | 6.13 | 6.32 | 6.63 | 6.93 | 7.12 | 7.43 |
| Pivot points | S3 | S2 | S1 | PP | R1 | R2 | R3 |
|---|---|---|---|---|---|---|---|
| Standard | 2.63 | 3.58 | 5.09 | 6.04 | 7.55 | 8.50 | 10.01 |
| Camarilla | 5.91 | 6.14 | 6.37 | 6.59 | 6.82 | 7.04 | 7.27 |
| Woodie | 2.90 | 3.72 | 5.36 | 6.18 | 7.82 | 8.64 | 10.28 |
| Fibonacci | 3.58 | 4.52 | 5.10 | 6.04 | 6.98 | 7.56 | 8.50 |
Numerical data
The following is the status of the technical indicators and moving averages at the time of publication of this technical analysis:
| RSI (14): | 41.90 | |
| MACD (12,26,9): | 0.0000 | |
| Directional Movement: | -6.24 | |
| AROON (14): | -78.57 | |
| DEMA (21): | 6.28 | |
| Parabolic SAR (0,02-0,02-0,2): | 6.30 | |
| Elder Ray (13): | -0.01 | |
| Super Trend (3,10): | 6.30 | |
| Zig ZAG (10): | 6.26 | |
| VORTEX (21): | 0.9100 | |
| Stochastique (14,3,5): | 23.91 | |
| TEMA (21): | 6.28 | |
| Williams %R (14): | -91.89 | |
| Chande Momentum Oscillator (20): | -0.02 | |
| Repulse (5,40,3): | -0.3700 | |
| ROCnROLL: | 2 | |
| TRIX (15,9): | 0.0000 | |
| Courbe Coppock: | 0.18 |
| MA7: | 6.32 | |
| MA20: | 6.48 | |
| MA50: | 6.01 | |
| MA100: | 5.89 | |
| MAexp7: | 6.28 | |
| MAexp20: | 6.28 | |
| MAexp50: | 6.28 | |
| MAexp100: | 6.28 | |
| Price / MA7: | -0.79% | |
| Price / MA20: | -3.24% | |
| Price / MA50: | +4.33% | |
| Price / MA100: | +6.45% | |
| Price / MAexp7: | -0.16% | |
| Price / MAexp20: | -0.16% | |
| Price / MAexp50: | -0.16% | |
| Price / MAexp100: | -0.16% |
About author

Online


Add a comment
Comments
0 comments on the analysis BTCUP - BTCUP/USDT - 15 min.