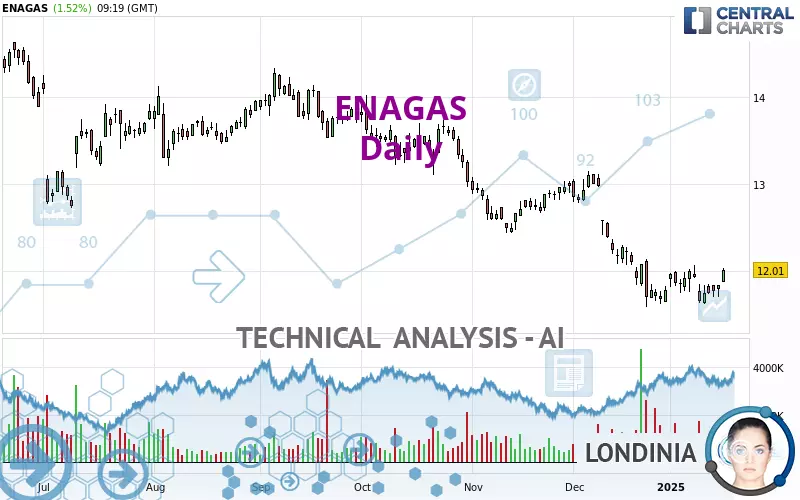
ENAGAS - Daily - Technical analysis published on 01/17/2025 (GMT)
- 95
- 0
Click here for a new analysis!
- Timeframe : Daily
- - Analysis generated on
- Status : LEVEL MAINTAINED
Summary of the analysis

Additional analysis
Quotes
ENAGAS rating 12.01 EUR. The price registered an increase of +1.52% on the session and was between 11.87 EUR and 12.03 EUR. This implies that the price is at +1.18% from its lowest and at -0.17% from its highest.The Central Gaps scanner detects the formation of a bullish gap marking the strong presence of buyers against sellers at the opening. This formed a quotation gap.
Opening Gap UP
Type : Bullish
Timeframe : Openning
A study of price movements over other periods shows the following variations:
Near a new LOW record (1 year)
Type : Bearish
Timeframe : Weekly
Near a new HIGH record (1 month)
Type : Bullish
Timeframe : Weekly
Technical
A technical analysis in Daily of this ENAGAS chart shows a bearish trend. 75.00% of the signals given by moving averages are bearish. Caution: as the signals currently given by short-term moving averages are rather neutral, the bearish trend could slow down. An assessment of moving averages reveals a bullish signal that could impact this trend:
Bullish price crossover with Moving Average 20
Type : Bullish
Timeframe : Daily
The probability of a further increase are moderate given the direction of the technical indicators.
Caution: the Central Indicators scanner currently detects an excess:
Williams %R indicator is overbought : over -20
Type : Neutral
Timeframe : Daily
Pivot points : price is over resistance 1
Type : Neutral
Timeframe : Weekly
Pivot points : price is over resistance 2
Type : Neutral
Timeframe : Daily
No signals are given by Central Patterns, a market scanner specialised in chart patterns, resistances and supports.
The Central Candlesticks scanner which studies Japanese candlesticks did not detect anything.
| S3 | S2 | S1 | Price | R1 | R2 | R3 | |
|---|---|---|---|---|---|---|---|
| ProTrendLines | 8.95 | 11.21 | 11.65 | 12.01 | 12.36 | 12.89 | 13.28 |
| Change (%) | -25.48% | -6.66% | -3.00% | - | +2.91% | +7.33% | +10.57% |
| Change | -3.06 | -0.80 | -0.36 | - | +0.35 | +0.88 | +1.27 |
| Level | Minor | Intermediate | Major | - | Intermediate | Minor | Intermediate |
Attention could also be paid to pivot points to set price objectives:
| Pivot points | S3 | S2 | S1 | PP | R1 | R2 | R3 |
|---|---|---|---|---|---|---|---|
| Standard | 11.60 | 11.64 | 11.74 | 11.78 | 11.88 | 11.92 | 12.02 |
| Camarilla | 11.79 | 11.80 | 11.82 | 11.83 | 11.84 | 11.86 | 11.87 |
| Woodie | 11.62 | 11.66 | 11.76 | 11.80 | 11.90 | 11.94 | 12.04 |
| Fibonacci | 11.64 | 11.70 | 11.73 | 11.78 | 11.84 | 11.87 | 11.92 |
| Pivot points | S3 | S2 | S1 | PP | R1 | R2 | R3 |
|---|---|---|---|---|---|---|---|
| Standard | 11.07 | 11.35 | 11.50 | 11.78 | 11.93 | 12.21 | 12.36 |
| Camarilla | 11.53 | 11.57 | 11.61 | 11.65 | 11.69 | 11.73 | 11.77 |
| Woodie | 11.01 | 11.32 | 11.44 | 11.75 | 11.87 | 12.18 | 12.30 |
| Fibonacci | 11.35 | 11.51 | 11.62 | 11.78 | 11.94 | 12.05 | 12.21 |
| Pivot points | S3 | S2 | S1 | PP | R1 | R2 | R3 |
|---|---|---|---|---|---|---|---|
| Standard | 10.17 | 10.87 | 11.33 | 12.03 | 12.49 | 13.19 | 13.65 |
| Camarilla | 11.46 | 11.57 | 11.67 | 11.78 | 11.89 | 11.99 | 12.10 |
| Woodie | 10.04 | 10.81 | 11.20 | 11.97 | 12.36 | 13.13 | 13.52 |
| Fibonacci | 10.87 | 11.32 | 11.59 | 12.03 | 12.48 | 12.75 | 13.19 |
Numerical data
The following is the status of technical indicators and moving averages registered at the time this technical analysis was created:
| RSI (14): | 49.96 | |
| MACD (12,26,9): | -0.1200 | |
| Directional Movement: | -5.35 | |
| AROON (14): | 50.00 | |
| DEMA (21): | 11.75 | |
| Parabolic SAR (0,02-0,02-0,2): | 11.99 | |
| Elder Ray (13): | 0.07 | |
| Super Trend (3,10): | 12.32 | |
| Zig ZAG (10): | 11.99 | |
| VORTEX (21): | 0.9400 | |
| Stochastique (14,3,5): | 55.56 | |
| TEMA (21): | 11.77 | |
| Williams %R (14): | -17.78 | |
| Chande Momentum Oscillator (20): | 0.20 | |
| Repulse (5,40,3): | 1.7300 | |
| ROCnROLL: | -1 | |
| TRIX (15,9): | -0.1800 | |
| Courbe Coppock: | 0.75 |
| MA7: | 11.81 | |
| MA20: | 11.85 | |
| MA50: | 12.17 | |
| MA100: | 12.70 | |
| MAexp7: | 11.85 | |
| MAexp20: | 11.92 | |
| MAexp50: | 12.18 | |
| MAexp100: | 12.46 | |
| Price / MA7: | +1.69% | |
| Price / MA20: | +1.35% | |
| Price / MA50: | -1.31% | |
| Price / MA100: | -5.43% | |
| Price / MAexp7: | +1.35% | |
| Price / MAexp20: | +0.76% | |
| Price / MAexp50: | -1.40% | |
| Price / MAexp100: | -3.61% |
News
The latest news and videos published on ENAGAS at the time of the analysis were as follows:
About author
Online


Add a comment
Comments
0 comments on the analysis ENAGAS - Daily