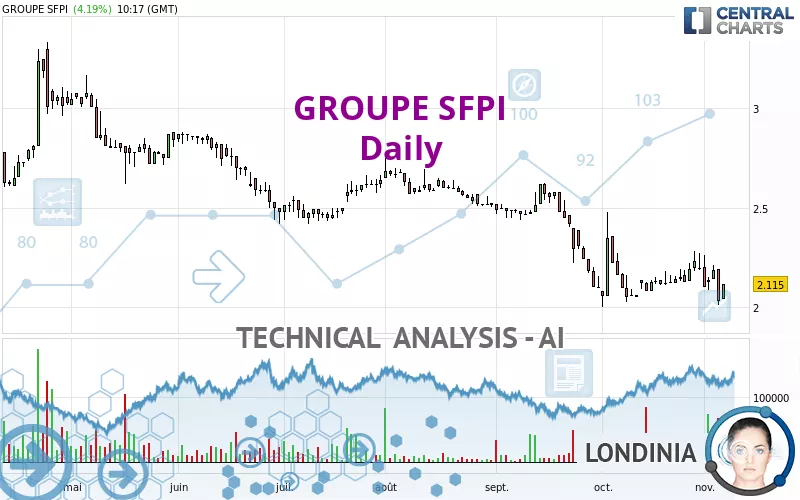
GROUPE SFPI - Daily - Technical analysis published on 11/07/2022 (GMT)
- 146
- 0
Click here for a new analysis!
- Timeframe : Daily
- - Analysis generated on
- Status : TARGET REACHED

Summary of the analysis

Additional analysis
Quotes
The GROUPE SFPI rating is 2.115 EUR. The price registered an increase of +4.19% on the session and was traded between 2.040 EUR and 2.115 EUR over the period. The price is currently at +3.68% from its lowest and 0% from its highest.A bullish opening was detected by the Central Gaps scanner. Buyers are trying to impose a bullish momentum in the very short term.
Bullish opening
Type : Bullish
Timeframe : Openning
So that you have an overall view of the price change, here is a table showing the variations over several periods:
Near a new LOW record (1 year)
Type : Bearish
Timeframe : Weekly
Near a new LOW record (1st january)
Type : Bearish
Timeframe : Weekly
Near a new LOW record (1 month)
Type : Bearish
Timeframe : Weekly
Technical
Technical analysis of GROUPE SFPI in Daily shows a overall strongly bearish trend. The signals given by moving averages are 89.29% bearish. This strongly bearish trend seems to be slowing down given the slightly bearish signals being given by short-term moving averages. The Central Indicators market scanner currently does not detect any result that concerns moving averages.
An assessment of technical indicators does not currently provide any relevant information to suggest whether the signal given by the technical indicators is more bullish or bearish.
Caution: the Central Indicators scanner currently detects an excess:
MACD indicator: bullish divergence
Type : Bullish
Timeframe : Daily
Price is back over the pivot point
Type : Bullish
Timeframe : Daily
Price is back over the pivot point
Type : Bullish
Timeframe : Weekly
An analysis of the price chart with the Central Patterns scanner (detector of chart patterns and resistances and supports) shows a result that can have an impact on the price change:
Near horizontal resistance
Type : Bearish
Timeframe : Daily
Central Candlesticks, the scanner specialised in Japanese candlesticks, detects a bullish signal that could support the hypothesis of a small rebound in the very short term:
Bullish harami
Type : Bullish
Timeframe : Daily
| S3 | S2 | S1 | Price | R1 | R2 | R3 | |
|---|---|---|---|---|---|---|---|
| ProTrendLines | 1.062 | 1.773 | 2.051 | 2.115 | 2.443 | 2.686 | 3.143 |
| Change (%) | -49.79% | -16.17% | -3.03% | - | +15.51% | +27.00% | +48.61% |
| Change | -1.053 | -0.342 | -0.064 | - | +0.328 | +0.571 | +1.028 |
| Level | Major | Major | Minor | - | Major | Minor | Intermediate |
Attention could also be paid to pivot points to set price objectives:
| Pivot points | S3 | S2 | S1 | PP | R1 | R2 | R3 |
|---|---|---|---|---|---|---|---|
| Standard | 1.783 | 1.897 | 1.963 | 2.077 | 2.143 | 2.257 | 2.323 |
| Camarilla | 1.981 | 1.997 | 2.014 | 2.030 | 2.047 | 2.063 | 2.080 |
| Woodie | 1.760 | 1.885 | 1.940 | 2.065 | 2.120 | 2.245 | 2.300 |
| Fibonacci | 1.897 | 1.965 | 2.008 | 2.077 | 2.145 | 2.188 | 2.257 |
| Pivot points | S3 | S2 | S1 | PP | R1 | R2 | R3 |
|---|---|---|---|---|---|---|---|
| Standard | 1.677 | 1.843 | 1.937 | 2.103 | 2.197 | 2.363 | 2.457 |
| Camarilla | 1.959 | 1.982 | 2.006 | 2.030 | 2.054 | 2.078 | 2.102 |
| Woodie | 1.640 | 1.825 | 1.900 | 2.085 | 2.160 | 2.345 | 2.420 |
| Fibonacci | 1.843 | 1.943 | 2.004 | 2.103 | 2.203 | 2.264 | 2.363 |
| Pivot points | S3 | S2 | S1 | PP | R1 | R2 | R3 |
|---|---|---|---|---|---|---|---|
| Standard | 1.487 | 1.743 | 1.967 | 2.223 | 2.447 | 2.703 | 2.927 |
| Camarilla | 2.058 | 2.102 | 2.146 | 2.190 | 2.234 | 2.278 | 2.322 |
| Woodie | 1.470 | 1.735 | 1.950 | 2.215 | 2.430 | 2.695 | 2.910 |
| Fibonacci | 1.743 | 1.927 | 2.040 | 2.223 | 2.407 | 2.520 | 2.703 |
Numerical data
The following is the status of technical indicators and moving averages registered at the time this technical analysis was created:
| RSI (14): | 45.55 | |
| MACD (12,26,9): | -0.0370 | |
| Directional Movement: | -5.673 | |
| AROON (14): | -35.714 | |
| DEMA (21): | 2.091 | |
| Parabolic SAR (0,02-0,02-0,2): | 2.322 | |
| Elder Ray (13): | -0.057 | |
| Super Trend (3,10): | 2.011 | |
| Zig ZAG (10): | 2.110 | |
| VORTEX (21): | 0.9160 | |
| Stochastique (14,3,5): | 32.93 | |
| TEMA (21): | 2.119 | |
| Williams %R (14): | -61.11 | |
| Chande Momentum Oscillator (20): | -0.005 | |
| Repulse (5,40,3): | -2.4580 | |
| ROCnROLL: | 2 | |
| TRIX (15,9): | -0.2930 | |
| Courbe Coppock: | 2.59 |
| MA7: | 2.141 | |
| MA20: | 2.124 | |
| MA50: | 2.274 | |
| MA100: | 2.420 | |
| MAexp7: | 2.123 | |
| MAexp20: | 2.148 | |
| MAexp50: | 2.253 | |
| MAexp100: | 2.398 | |
| Price / MA7: | -1.21% | |
| Price / MA20: | -0.42% | |
| Price / MA50: | -6.99% | |
| Price / MA100: | -12.60% | |
| Price / MAexp7: | -0.38% | |
| Price / MAexp20: | -1.54% | |
| Price / MAexp50: | -6.13% | |
| Price / MAexp100: | -11.80% |
News
Don't forget to follow the news on GROUPE SFPI. At the time of publication of this analysis, the latest news was as follows:
- Wood Fiber Costs for Softwood Pulp Manufacturers in 16 Countries Have Gone up the Past Two Years, and as a Result, in the 1Q/19, the SFPI Price Index Reached Its Highest Level in Five Years
- Sequana Medical establishes new corporate headquarters in Ghent, Belgium and raises €8.5 million from leading Belgian investors including Newton Biocapital, PMV and SFPI-FPIM as well as existing shareholders
-
 Groupe SFPI
-
Groupe SFPI
About author
Online


Add a comment
Comments
0 comments on the analysis GROUPE SFPI - Daily