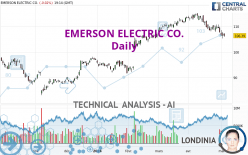
EMERSON ELECTRIC CO. - Daily - Technical analysis published on 05/03/2024 (GMT)
- 94
- 0
Click here for a new analysis!
- Timeframe : Daily
- - Analysis generated on
- Status : INVALID

Summary of the analysis

Additional analysis
Quotes
The EMERSON ELECTRIC CO. rating is 106.39 USD. The price is lower by -0.02% since the last closing and was between 105.95 USD and 107.38 USD. This implies that the price is at +0.42% from its lowest and at -0.92% from its highest.The Central Gaps scanner detects a bullish opening marking the presence of buyers ahead of sellers at the opening but not sufficiently marked to allow the price to register a quotation gap.
Bullish opening
Type : Bullish
Timeframe : Openning
A study of price movements over other periods shows the following variations:
Near a new HIGH record (5 years)
Type : Bullish
Timeframe : Weekly
Near a new LOW record (1 month)
Type : Bearish
Timeframe : Weekly
Technical
A technical analysis in Daily of this EMERSON ELECTRIC CO. chart shows a slightly bullish trend. 53.57% of the signals given by moving averages are bullish. Caution: the strong bearish signals currently given by short-term moving averages indicate that a trend reversal may be taking place. An assessment of moving averages reveals a bearish signal that could impact this trend:
Moving Average bearish crossovers : MA20 & MA50
Type : Bearish
Timeframe : Daily
In fact, 14 technical indicators on 18 studied are currently bearish. But beware of excesses. The Central Indicators scanner currently detects this:
RSI indicator is oversold : under 30
Type : Neutral
Timeframe : Daily
CCI indicator is oversold : under -100
Type : Neutral
Timeframe : Daily
CCI indicator: bullish divergence
Type : Bullish
Timeframe : Daily
RSI indicator: bullish divergence
Type : Bullish
Timeframe : Daily
Williams %R indicator is oversold : under -80
Type : Neutral
Timeframe : Daily
Pivot points : price is under support 2
Type : Neutral
Timeframe : Weekly
Price is back under the pivot point
Type : Bearish
Timeframe : Daily
The Central Patterns scanner, which studies chart patterns, resistances and supports, has identified this signal:
Near horizontal resistance
Type : Bearish
Timeframe : Daily
The Central Candlesticks scanner which studies Japanese candlesticks did not detect anything.
| S3 | S2 | S1 | Price | R1 | R2 | R3 | |
|---|---|---|---|---|---|---|---|
| ProTrendLines | 91.16 | 96.01 | 100.44 | 106.39 | 108.58 | 111.73 | 114.67 |
| Change (%) | -14.32% | -9.76% | -5.59% | - | +2.06% | +5.02% | +7.78% |
| Change | -15.23 | -10.38 | -5.95 | - | +2.19 | +5.34 | +8.28 |
| Level | Intermediate | Major | Intermediate | - | Intermediate | Minor | Major |
To determine price objectives, it is also possible to use the pivot points. Here is the price position in relation to pivot points:
| Pivot points | S3 | S2 | S1 | PP | R1 | R2 | R3 |
|---|---|---|---|---|---|---|---|
| Standard | 102.58 | 103.92 | 105.17 | 106.51 | 107.76 | 109.10 | 110.35 |
| Camarilla | 105.70 | 105.94 | 106.17 | 106.41 | 106.65 | 106.89 | 107.12 |
| Woodie | 102.53 | 103.90 | 105.12 | 106.49 | 107.71 | 109.08 | 110.30 |
| Fibonacci | 103.92 | 104.91 | 105.52 | 106.51 | 107.50 | 108.11 | 109.10 |
| Pivot points | S3 | S2 | S1 | PP | R1 | R2 | R3 |
|---|---|---|---|---|---|---|---|
| Standard | 105.29 | 106.54 | 108.22 | 109.47 | 111.15 | 112.40 | 114.08 |
| Camarilla | 109.08 | 109.35 | 109.62 | 109.89 | 110.16 | 110.43 | 110.70 |
| Woodie | 105.50 | 106.65 | 108.43 | 109.58 | 111.36 | 112.51 | 114.29 |
| Fibonacci | 106.54 | 107.66 | 108.35 | 109.47 | 110.59 | 111.28 | 112.40 |
| Pivot points | S3 | S2 | S1 | PP | R1 | R2 | R3 |
|---|---|---|---|---|---|---|---|
| Standard | 97.49 | 102.54 | 105.16 | 110.21 | 112.83 | 117.88 | 120.50 |
| Camarilla | 105.67 | 106.37 | 107.08 | 107.78 | 108.48 | 109.19 | 109.89 |
| Woodie | 96.28 | 101.93 | 103.95 | 109.60 | 111.62 | 117.27 | 119.29 |
| Fibonacci | 102.54 | 105.47 | 107.28 | 110.21 | 113.14 | 114.95 | 117.88 |
Numerical data
The following are the details of the technical indicators and moving averages that were collected to generate this technical analysis:
| RSI (14): | 29.14 | |
| MACD (12,26,9): | -1.0500 | |
| Directional Movement: | -16.18 | |
| AROON (14): | -92.86 | |
| DEMA (21): | 108.35 | |
| Parabolic SAR (0,02-0,02-0,2): | 110.26 | |
| Elder Ray (13): | -2.02 | |
| Super Trend (3,10): | 112.36 | |
| Zig ZAG (10): | 106.54 | |
| VORTEX (21): | 0.8200 | |
| Stochastique (14,3,5): | 11.02 | |
| TEMA (21): | 106.51 | |
| Williams %R (14): | -82.44 | |
| Chande Momentum Oscillator (20): | -3.30 | |
| Repulse (5,40,3): | -2.5200 | |
| ROCnROLL: | 2 | |
| TRIX (15,9): | -0.0700 | |
| Courbe Coppock: | 8.26 |
| MA7: | 108.04 | |
| MA20: | 110.22 | |
| MA50: | 110.43 | |
| MA100: | 103.49 | |
| MAexp7: | 107.64 | |
| MAexp20: | 109.36 | |
| MAexp50: | 108.53 | |
| MAexp100: | 104.57 | |
| Price / MA7: | -1.53% | |
| Price / MA20: | -3.47% | |
| Price / MA50: | -3.66% | |
| Price / MA100: | +2.80% | |
| Price / MAexp7: | -1.16% | |
| Price / MAexp20: | -2.72% | |
| Price / MAexp50: | -1.97% | |
| Price / MAexp100: | +1.74% |
News
The last news published on EMERSON ELECTRIC CO. at the time of the generation of this analysis was as follows:
- Turnspire Capital Partners Completes Acquisition of the Daniel Measurement and Control Business of Emerson Electric
- Turnspire Capital Partners Agrees to Acquire the Daniel Measurement and Control Business of Emerson Electric
- Research Report Identifies Stryker, Total System Services, Vista Outdoor, Plains All American Pipeline, Emerson Electric, and IZEA with Renewed Outlook — Fundamental Analysis, Calculating Forward Movement
- Research Report Identifies Avangrid, Entercom Communications, Kennedy-Wilson, Emerson Electric, Amgen, and vTv Therapeutics with Renewed Outlook — Fundamental Analysis, Calculating Forward Movement
-
 Emerson Electric CEO: Tariff Knockback | Mad Money | CNBC
About author
Online


Add a comment
Comments
0 comments on the analysis EMERSON ELECTRIC CO. - Daily