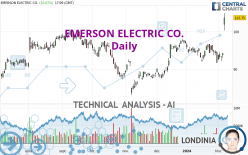
EMERSON ELECTRIC CO. - Daily - Technical analysis published on 02/07/2024 (GMT)
- 100
- 0
- Timeframe : Daily
- - Analysis generated on
- Status : WITHOUT TARGET

Summary of the analysis

Additional analysis
Quotes
The EMERSON ELECTRIC CO. rating is 103.75 USD. The price has increased by +10.07% since the last closing and was between 100.30 USD and 104.95 USD. This implies that the price is at +3.44% from its lowest and at -1.14% from its highest.The Central Gaps scanner detects the formation of a bullish gap marking the strong presence of buyers against sellers at the opening. This formed a quotation gap.
Opening Gap UP
Type : Bullish
Timeframe : Openning
Here is a more detailed summary of the historical variations registered by EMERSON ELECTRIC CO.:
New HIGH record (5 years)
Type : Bullish
Timeframe : Weekly
New HIGH record (1 year)
Type : Bullish
Timeframe : Weekly
New HIGH record (1st january)
Type : Bullish
Timeframe : Weekly
New HIGH record (1 month)
Type : Bullish
Timeframe : Weekly
Technical
Technical analysis of this Daily chart of EMERSON ELECTRIC CO. indicates that the overall trend is strongly bullish. The signals given by the moving averages are 92.86% bullish. This strong bullish trend is confirmed by the strong signals currently being given by short-term moving averages. The Central Indicators scanner detects bullish signals on moving averages that could impact this trend:
Moving Average bullish crossovers : AMA50 & AMA100
Type : Bullish
Timeframe : Daily
Bullish price crossover with Moving Average 20
Type : Bullish
Timeframe : Daily
Bullish price crossover with adaptative moving average 20
Type : Bullish
Timeframe : Daily
In fact, according to the parameters integrated into the Central Analyzer system, 13 technical indicators out of 18 analysed are currently bullish. Caution: the Central Indicators scanner currently detects an excess:
RSI indicator is overbought : over 70
Type : Neutral
Timeframe : Daily
CCI indicator is overbought : over 100
Type : Neutral
Timeframe : Daily
Williams %R indicator is overbought : over -20
Type : Neutral
Timeframe : Daily
Pivot points : price is over resistance 3
Type : Neutral
Timeframe : Daily
Pivot points : price is over resistance 3
Type : Neutral
Timeframe : Weekly
MACD crosses UP its Moving Average
Type : Bullish
Timeframe : Daily
Parabolic SAR indicator bullish reversal
Type : Bullish
Timeframe : Daily
Aroon indicator bullish trend
Type : Bullish
Timeframe : Daily
Ichimoku : price is over the cloud
Type : Bullish
Timeframe : Daily
SuperTrend indicator bullish reversal
Type : Bullish
Timeframe : Daily
MACD indicator is back over 0
Type : Bullish
Timeframe : Daily
Momentum indicator is back over 0
Type : Bullish
Timeframe : Daily
Central Patterns, the market scanner focusing on chart patterns, resistances and supports found these results:
Horizontal resistance is broken
Type : Bullish
Timeframe : Daily
Resistance of channel is broken
Type : Bullish
Timeframe : Daily
For a small rebound in the very short term, the Central Candlesticks scanner currently notes the presence of these bullish patterns in Japanese candlesticks:
Upside gap
Type : Bullish
Timeframe : Daily
Long white line
Type : Bullish
Timeframe : Daily
| S3 | S2 | S1 | Price | |
|---|---|---|---|---|
| ProTrendLines | 94.56 | 96.49 | 100.94 | 103.75 |
| Change (%) | -8.86% | -7.00% | -2.71% | - |
| Change | -9.19 | -7.26 | -2.81 | - |
| Level | Intermediate | Major | Major | - |
To determine price objectives, it is also possible to use the pivot points. Here is the price position in relation to pivot points:
| Pivot points | S3 | S2 | S1 | PP | R1 | R2 | R3 |
|---|---|---|---|---|---|---|---|
| Standard | 92.05 | 92.54 | 93.40 | 93.89 | 94.75 | 95.24 | 96.10 |
| Camarilla | 93.89 | 94.01 | 94.14 | 94.26 | 94.38 | 94.51 | 94.63 |
| Woodie | 92.24 | 92.63 | 93.59 | 93.98 | 94.94 | 95.33 | 96.29 |
| Fibonacci | 92.54 | 93.06 | 93.37 | 93.89 | 94.41 | 94.72 | 95.24 |
| Pivot points | S3 | S2 | S1 | PP | R1 | R2 | R3 |
|---|---|---|---|---|---|---|---|
| Standard | 88.53 | 90.09 | 92.03 | 93.59 | 95.53 | 97.09 | 99.03 |
| Camarilla | 93.02 | 93.34 | 93.66 | 93.98 | 94.30 | 94.62 | 94.94 |
| Woodie | 88.73 | 90.19 | 92.23 | 93.69 | 95.73 | 97.19 | 99.23 |
| Fibonacci | 90.09 | 91.42 | 92.25 | 93.59 | 94.92 | 95.75 | 97.09 |
| Pivot points | S3 | S2 | S1 | PP | R1 | R2 | R3 |
|---|---|---|---|---|---|---|---|
| Standard | 84.66 | 88.15 | 89.94 | 93.43 | 95.22 | 98.71 | 100.50 |
| Camarilla | 90.28 | 90.76 | 91.25 | 91.73 | 92.21 | 92.70 | 93.18 |
| Woodie | 83.81 | 87.73 | 89.09 | 93.01 | 94.37 | 98.29 | 99.65 |
| Fibonacci | 88.15 | 90.17 | 91.41 | 93.43 | 95.45 | 96.69 | 98.71 |
Numerical data
The following is the status of the technical indicators and moving averages at the time of publication of this technical analysis:
| RSI (14): | 72.15 | |
| MACD (12,26,9): | 0.7500 | |
| Directional Movement: | 30.54 | |
| AROON (14): | 35.71 | |
| DEMA (21): | 96.11 | |
| Parabolic SAR (0,02-0,02-0,2): | 91.64 | |
| Elder Ray (13): | 7.00 | |
| Super Trend (3,10): | 94.81 | |
| Zig ZAG (10): | 104.05 | |
| VORTEX (21): | 0.9400 | |
| Stochastique (14,3,5): | 59.26 | |
| TEMA (21): | 96.18 | |
| Williams %R (14): | -8.04 | |
| Chande Momentum Oscillator (20): | 7.73 | |
| Repulse (5,40,3): | 4.0800 | |
| ROCnROLL: | 1 | |
| TRIX (15,9): | 0.0400 | |
| Courbe Coppock: | 2.84 |
| MA7: | 95.09 | |
| MA20: | 94.87 | |
| MA50: | 93.76 | |
| MA100: | 92.86 | |
| MAexp7: | 96.41 | |
| MAexp20: | 95.24 | |
| MAexp50: | 94.10 | |
| MAexp100: | 93.04 | |
| Price / MA7: | +9.11% | |
| Price / MA20: | +9.36% | |
| Price / MA50: | +10.65% | |
| Price / MA100: | +11.73% | |
| Price / MAexp7: | +7.61% | |
| Price / MAexp20: | +8.94% | |
| Price / MAexp50: | +10.26% | |
| Price / MAexp100: | +11.51% |
News
The latest news and videos published on EMERSON ELECTRIC CO. at the time of the analysis were as follows:
- Turnspire Capital Partners Completes Acquisition of the Daniel Measurement and Control Business of Emerson Electric
- Turnspire Capital Partners Agrees to Acquire the Daniel Measurement and Control Business of Emerson Electric
- Research Report Identifies Stryker, Total System Services, Vista Outdoor, Plains All American Pipeline, Emerson Electric, and IZEA with Renewed Outlook — Fundamental Analysis, Calculating Forward Movement
- Research Report Identifies Avangrid, Entercom Communications, Kennedy-Wilson, Emerson Electric, Amgen, and vTv Therapeutics with Renewed Outlook — Fundamental Analysis, Calculating Forward Movement
-
 Emerson Electric CEO: Tariff Knockback | Mad Money | CNBC
About author
Online


Add a comment
Comments
0 comments on the analysis EMERSON ELECTRIC CO. - Daily