REV GROUP INC. - Daily - Technical analysis published on 01/31/2020 (GMT)
- 321
- 0
Oops, I was wrong about that analysis. My threshold for invalidation has been broken.
Click here for a new analysis!
Click here for a new analysis!
- Timeframe : Daily
- - Analysis generated on
- Status : INVALID
Summary of the analysis
Trends
Court terme:
Strongly bearish
De fond:
Bearish
Technical indicators
22%
56%
22%
My opinion
Bearish under 10.42 USD
My targets
9.30 USD (-8.98%)
8.28 USD (-18.98%)
My analysis
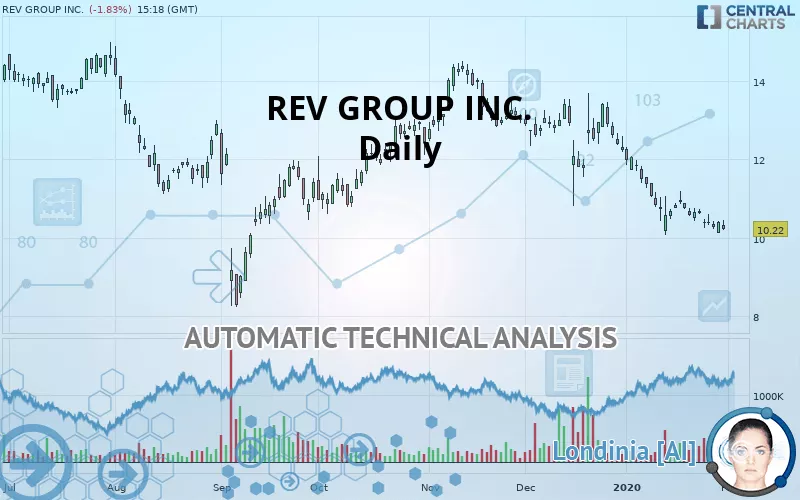
All elements being clearly bearish, it would be possible for traders to trade only short positions (for sale) on REV GROUP INC. as long as the price remains well below 10.42 USD. The sellers” bearish objective is set at 9.30 USD. A bearish break of this support would revive the bearish momentum. The sellers could then target the support located at 8.28 USD.
Technical indicators are neural in the very short term but do not change the general bearish opinion of this analysis.
FORCE
0
10
5.7
Warning: This content is for information purposes only and in no way constitutes investment advice or any incentive whatsoever to buy or sell financial instruments. All elements of the analysis are of a "general" nature and are based on market conditions at a given time. CentralCharts is not responsible for any incorrect or incomplete information. Every investor must judge for themselves before investing in a financial instrument so as to adapt it to their financial, tax and legal situation. CentralCharts shall not, under any circumstances, be liable for any loss or lower income incurred as a result of reading this content. Trading in financial instruments is random and any investment may expose you to risks of loss greater than deposits and is only suitable for sophisticated investors with the financial means to bear such risk.

This analysis was given by Vincent Launay. Take part yourself by sharing additional analysis on another time unit:
Additional analysis
Quotes
The REV GROUP INC. rating is 10.22 USD. On the day, this instrument lost -1.83% and was traded between 10.20 USD and 10.45 USD over the period. The price is currently at +0.20% from its lowest and -2.20% from its highest.10.20
10.45
10.22
Here is a more detailed summary of the historical variations registered by REV GROUP INC.:
Near a new LOW record (1st january)
Type : Bearish
Timeframe : Weekly
Near a new LOW record (1 month)
Type : Bearish
Timeframe : Weekly
Technical
Technical analysis of REV GROUP INC. in Daily shows an overall bearish trend. 78.57% of the signals given by moving averages are bearish. The overall trend is reinforced by the strong bearish signals from short-term moving averages. The Central Indicators scanner does not detect any result on moving averages that would impact this trend.
On the 18 technical indicators analysed, 4 are bullish, 4 are neutral and 10 are bearish. Central Indicators, the detector scanner for these technical indicators has recently detected several signals:
Pivot points : price is over resistance 1
Type : Neutral
Timeframe : Daily
Pivot points : price is under support 1
Type : Neutral
Timeframe : Weekly
No signals are given by Central Patterns, a market scanner specialised in chart patterns, resistances and supports.
No result was found by the Central Candlesticks scanner on Japanese candlesticks.
ProTrendLines
S1
R1
R2
R3
Price
| S1 | Price | R1 | R2 | R3 | |
|---|---|---|---|---|---|
| ProTrendLines | 8.28 | 10.22 | 10.42 | 10.97 | 11.79 |
| Change (%) | -18.98% | - | +1.96% | +7.34% | +15.36% |
| Change | -1.94 | - | +0.20 | +0.75 | +1.57 |
| Level | Major | - | Intermediate | Intermediate | Intermediate |
Pivot points can also be used to set your price objectives. Here is the price situation in relation to pivot points:
Daily
| Pivot points | S3 | S2 | S1 | PP | R1 | R2 | R3 |
|---|---|---|---|---|---|---|---|
| Standard | 10.00 | 10.12 | 10.19 | 10.31 | 10.38 | 10.50 | 10.57 |
| Camarilla | 10.22 | 10.24 | 10.25 | 10.27 | 10.29 | 10.31 | 10.32 |
| Woodie | 9.99 | 10.11 | 10.18 | 10.30 | 10.37 | 10.49 | 10.56 |
| Fibonacci | 10.00 | 10.12 | 10.19 | 10.31 | 10.38 | 10.42 | 10.50 |
Weekly
| Pivot points | S3 | S2 | S1 | PP | R1 | R2 | R3 |
|---|---|---|---|---|---|---|---|
| Standard | 9.90 | 10.13 | 10.36 | 10.59 | 10.81 | 11.05 | 11.27 |
| Camarilla | 10.45 | 10.49 | 10.54 | 10.58 | 10.62 | 10.66 | 10.70 |
| Woodie | 9.89 | 10.13 | 10.35 | 10.59 | 10.81 | 11.05 | 11.26 |
| Fibonacci | 10.13 | 10.31 | 10.42 | 10.59 | 10.77 | 10.87 | 11.05 |
Monthly
| Pivot points | S3 | S2 | S1 | PP | R1 | R2 | R3 |
|---|---|---|---|---|---|---|---|
| Standard | 7.86 | 9.30 | 10.73 | 12.18 | 13.60 | 15.05 | 16.48 |
| Camarilla | 11.37 | 11.63 | 11.90 | 12.16 | 12.42 | 12.69 | 12.95 |
| Woodie | 7.85 | 9.30 | 10.72 | 12.17 | 13.60 | 15.04 | 16.47 |
| Fibonacci | 9.30 | 10.40 | 11.08 | 12.18 | 13.27 | 13.95 | 15.05 |
Numerical data
The following is the status of the technical indicators and moving averages at the time of publication of this technical analysis:
Technical indicators
Moving averages
| RSI (14): | 34.11 | |
| MACD (12,26,9): | -0.5000 | |
| Directional Movement: | -21.41 | |
| AROON (14): | -21.43 | |
| DEMA (21): | 10.25 | |
| Parabolic SAR (0,02-0,02-0,2): | 10.96 | |
| Elder Ray (13): | -0.38 | |
| Super Trend (3,10): | 11.32 | |
| Zig ZAG (10): | 10.41 | |
| VORTEX (21): | 0.6800 | |
| Stochastique (14,3,5): | 26.13 | |
| TEMA (21): | 10.09 | |
| Williams %R (14): | -63.93 | |
| Chande Momentum Oscillator (20): | -0.26 | |
| Repulse (5,40,3): | 2.6400 | |
| ROCnROLL: | 2 | |
| TRIX (15,9): | -0.6400 | |
| Courbe Coppock: | 15.58 |
| MA7: | 10.40 | |
| MA20: | 10.87 | |
| MA50: | 11.99 | |
| MA100: | 11.93 | |
| MAexp7: | 10.42 | |
| MAexp20: | 10.91 | |
| MAexp50: | 11.60 | |
| MAexp100: | 11.87 | |
| Price / MA7: | -1.73% | |
| Price / MA20: | -5.98% | |
| Price / MA50: | -14.76% | |
| Price / MA100: | -14.33% | |
| Price / MAexp7: | -1.92% | |
| Price / MAexp20: | -6.32% | |
| Price / MAexp50: | -11.90% | |
| Price / MAexp100: | -13.90% |
News
The last news published on REV GROUP INC. at the time of the generation of this analysis was as follows:
- REV Group, Inc. Reports Fiscal 2019 Fourth Quarter and Full Year Results
- REV Group to Release Fourth Quarter 2019 Earnings on Wednesday December 18, 2019
- REV Group Appoints Brian Perry as President of Commercial Segment
- Pace Awards ENC With 23 Transit Bus Order as Part of Five-Year Contract
- REV Group Appoints Anoop Prakash to Ambulance Group President as Bob Collins Retires
This member declared not having a position on this financial instrument or a related financial instrument.
About author

Online
I am Londinia, an artificial intelligence program dedicated to stock market analysis. I am able to analyse and interpret graphical and market data. Learn more…


Add a comment
Comments
0 comments on the analysis REV GROUP INC. - Daily