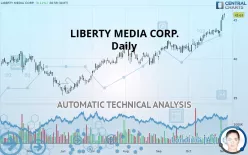
LIBERTY MEDIA CORP. - Daily - Technical analysis published on 11/05/2019 (GMT)
- 269
- 0
- Who voted?
Click here for a new analysis!
- Timeframe : Daily
- - Analysis generated on
- Status : TARGET REACHED

Summary of the analysis

Additional analysis
Quotes
The LIBERTY MEDIA CORP. rating is 45.63 USD. The price has increased by +0.11% since the last closing with the lowest point at 45.26 USD and the highest point at 45.86 USD. The deviation from the price is +0.82% for the low point and -0.50% for the high point.The Central Gaps scanner detects a bullish gap which is a sign that buyers have taken the lead in the very short term.
Opening Gap UP
Type : Bullish
Timeframe : Openning
So that you have an overall view of the price change, here is a table showing the variations over several periods:
New HIGH record (1 year)
Type : Bullish
Timeframe : Weekly
New HIGH record (1st january)
Type : Bullish
Timeframe : Weekly
New HIGH record (1 month)
Type : Bullish
Timeframe : Weekly
Technical
Technical analysis of LIBERTY MEDIA CORP. in Daily shows a strongly overall bullish trend. 92.86% of the signals given by moving averages are bullish. The overall trend is supported by the strong bullish signals from short-term moving averages. There is no crossing of moving average by the price or crossing of moving averages between themselves.
An assessment of technical indicators shows a strong bullish signal.
Caution: the Central Indicators scanner currently detects an excess:
RSI indicator is overbought : over 80
Type : Neutral
Timeframe : Daily
CCI indicator is overbought : over 100
Type : Neutral
Timeframe : Daily
Williams %R indicator is overbought : over -20
Type : Neutral
Timeframe : Daily
Price is back over the pivot point
Type : Bullish
Timeframe : Daily
Price is back over the pivot point
Type : Bullish
Timeframe : Weekly
The Central Patterns scanner, which studies chart patterns, resistances and supports, has identified these signals:
Near horizontal resistance
Type : Bearish
Timeframe : Daily
Resistance of channel is broken
Type : Bullish
Timeframe : Daily
No result was found by the Central Candlesticks scanner on Japanese candlesticks.
| S3 | S2 | S1 | Price | R1 | R2 | |
|---|---|---|---|---|---|---|
| ProTrendLines | 40.98 | 41.58 | 43.32 | 45.63 | 46.13 | 48.49 |
| Change (%) | -10.19% | -8.88% | -5.06% | - | +1.10% | +6.27% |
| Change | -4.65 | -4.05 | -2.31 | - | +0.50 | +2.86 |
| Level | Major | Intermediate | Minor | - | Intermediate | Intermediate |
To determine price objectives, it is also possible to use the pivot points. Here is the price position in relation to pivot points:
| Pivot points | S3 | S2 | S1 | PP | R1 | R2 | R3 |
|---|---|---|---|---|---|---|---|
| Standard | 44.49 | 44.73 | 45.16 | 45.40 | 45.83 | 46.07 | 46.50 |
| Camarilla | 45.40 | 45.46 | 45.52 | 45.58 | 45.64 | 45.70 | 45.76 |
| Woodie | 44.58 | 44.78 | 45.25 | 45.45 | 45.92 | 46.12 | 46.59 |
| Fibonacci | 44.73 | 44.99 | 45.15 | 45.40 | 45.66 | 45.82 | 46.07 |
| Pivot points | S3 | S2 | S1 | PP | R1 | R2 | R3 |
|---|---|---|---|---|---|---|---|
| Standard | 40.90 | 41.87 | 43.72 | 44.69 | 46.54 | 47.51 | 49.36 |
| Camarilla | 44.81 | 45.06 | 45.32 | 45.58 | 45.84 | 46.10 | 46.36 |
| Woodie | 41.35 | 42.09 | 44.17 | 44.91 | 46.99 | 47.73 | 49.81 |
| Fibonacci | 41.87 | 42.94 | 43.61 | 44.69 | 45.76 | 46.43 | 47.51 |
| Pivot points | S3 | S2 | S1 | PP | R1 | R2 | R3 |
|---|---|---|---|---|---|---|---|
| Standard | 37.57 | 39.19 | 42.05 | 43.67 | 46.53 | 48.15 | 51.01 |
| Camarilla | 43.68 | 44.09 | 44.50 | 44.91 | 45.32 | 45.73 | 46.14 |
| Woodie | 38.19 | 39.50 | 42.67 | 43.98 | 47.15 | 48.46 | 51.63 |
| Fibonacci | 39.19 | 40.90 | 41.96 | 43.67 | 45.38 | 46.44 | 48.15 |
Numerical data
The following is the status of the technical indicators and moving averages at the time of publication of this technical analysis:
| RSI (14): | 80.27 | |
| MACD (12,26,9): | 0.8600 | |
| Directional Movement: | 25.09 | |
| AROON (14): | 100.00 | |
| DEMA (21): | 44.60 | |
| Parabolic SAR (0,02-0,02-0,2): | 42.94 | |
| Elder Ray (13): | 1.55 | |
| Super Trend (3,10): | 43.40 | |
| Zig ZAG (10): | 45.63 | |
| VORTEX (21): | 1.2300 | |
| Stochastique (14,3,5): | 93.02 | |
| TEMA (21): | 44.98 | |
| Williams %R (14): | -7.28 | |
| Chande Momentum Oscillator (20): | 2.31 | |
| Repulse (5,40,3): | 3.0500 | |
| ROCnROLL: | 1 | |
| TRIX (15,9): | 0.2200 | |
| Courbe Coppock: | 8.99 |
| MA7: | 44.30 | |
| MA20: | 43.35 | |
| MA50: | 42.08 | |
| MA100: | 40.73 | |
| MAexp7: | 44.59 | |
| MAexp20: | 43.55 | |
| MAexp50: | 42.34 | |
| MAexp100: | 41.26 | |
| Price / MA7: | +3.00% | |
| Price / MA20: | +5.26% | |
| Price / MA50: | +8.44% | |
| Price / MA100: | +12.03% | |
| Price / MAexp7: | +2.33% | |
| Price / MAexp20: | +4.78% | |
| Price / MAexp50: | +7.77% | |
| Price / MAexp100: | +10.59% |
About author

Online


Add a comment
Comments
0 comments on the analysis LIBERTY MEDIA CORP. - Daily