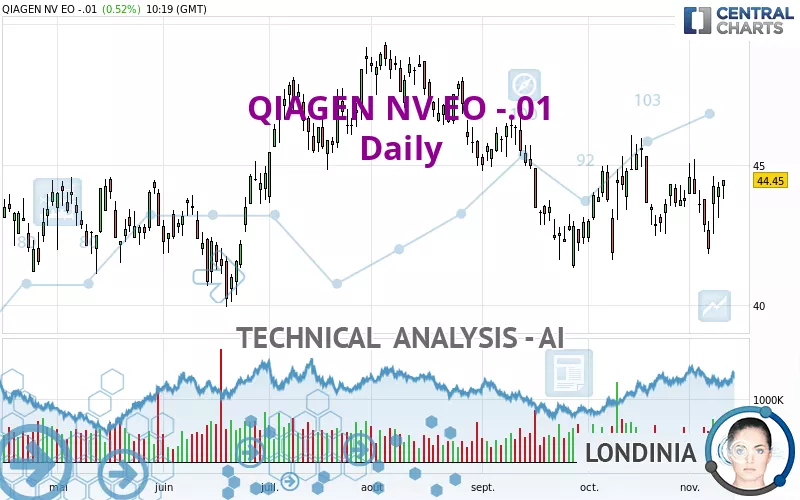
QIAGEN NV EO -.01 - Daily - Technical analysis published on 11/10/2022 (GMT)
- 223
- 0
- Timeframe : Daily
- - Analysis generated on
- Status : NEUTRAL

Summary of the analysis

Additional analysis
Quotes
The QIAGEN NV EO -.01 price is 44.45 EUR. On the day, this instrument gained +0.52% and was traded between 43.80 EUR and 44.47 EUR over the period. The price is currently at +1.48% from its lowest and -0.04% from its highest.The Central Gaps scanner detects a bullish opening marking the presence of buyers ahead of sellers at the opening but not sufficiently marked to allow the price to register a quotation gap.
Bullish opening
Type : Bullish
Timeframe : Openning
So that you have an overall view of the price change, here is a table showing the variations over several periods:
Near a new LOW record (1 month)
Type : Bearish
Timeframe : Weekly
Technical
A technical analysis in Daily of this QIAGEN NV EO -.01 chart shows a neutral trend. This indecision could turn into a bullish trend due to the bullish signals currently being given by short-term moving averages. An assessment of moving averages reveals a bullish signal that could impact this trend:
Bullish price crossover with adaptative moving average 50
Type : Bullish
Timeframe : Daily
Technical indicators are strongly bullish, suggesting that the price increase should continue.
The Central Indicators scanner found this result concerning these indicators:
Price is back over the pivot point
Type : Bullish
Timeframe : Weekly
An analysis of the price chart with the Central Patterns scanner (detector of chart patterns and resistances and supports) shows several results that can have an impact on the price change:
Near resistance of channel
Type : Bearish
Timeframe : Daily
Near resistance of triangle
Type : Bearish
Timeframe : Daily
The Central Candlesticks scanner which studies Japanese candlesticks did not detect anything.
| S3 | S2 | S1 | Price | R1 | R2 | R3 | |
|---|---|---|---|---|---|---|---|
| ProTrendLines | 38.62 | 40.22 | 43.55 | 44.45 | 45.51 | 46.46 | 47.85 |
| Change (%) | -13.12% | -9.52% | -2.02% | - | +2.38% | +4.52% | +7.65% |
| Change | -5.83 | -4.23 | -0.90 | - | +1.06 | +2.01 | +3.40 |
| Level | Major | Minor | Major | - | Major | Intermediate | Minor |
Pivot points can also be used to set your price objectives. Here is the price situation in relation to pivot points:
| Pivot points | S3 | S2 | S1 | PP | R1 | R2 | R3 |
|---|---|---|---|---|---|---|---|
| Standard | 42.14 | 42.62 | 43.42 | 43.90 | 44.70 | 45.18 | 45.98 |
| Camarilla | 43.87 | 43.99 | 44.10 | 44.22 | 44.34 | 44.46 | 44.57 |
| Woodie | 42.30 | 42.70 | 43.58 | 43.98 | 44.86 | 45.26 | 46.14 |
| Fibonacci | 42.62 | 43.11 | 43.41 | 43.90 | 44.39 | 44.69 | 45.18 |
| Pivot points | S3 | S2 | S1 | PP | R1 | R2 | R3 |
|---|---|---|---|---|---|---|---|
| Standard | 39.31 | 40.96 | 41.91 | 43.56 | 44.51 | 46.16 | 47.11 |
| Camarilla | 42.16 | 42.39 | 42.63 | 42.87 | 43.11 | 43.35 | 43.59 |
| Woodie | 38.97 | 40.79 | 41.57 | 43.39 | 44.17 | 45.99 | 46.77 |
| Fibonacci | 40.96 | 41.95 | 42.56 | 43.56 | 44.55 | 45.16 | 46.16 |
| Pivot points | S3 | S2 | S1 | PP | R1 | R2 | R3 |
|---|---|---|---|---|---|---|---|
| Standard | 37.10 | 39.36 | 41.53 | 43.79 | 45.96 | 48.22 | 50.39 |
| Camarilla | 42.48 | 42.89 | 43.29 | 43.70 | 44.11 | 44.51 | 44.92 |
| Woodie | 37.06 | 39.34 | 41.49 | 43.77 | 45.92 | 48.20 | 50.35 |
| Fibonacci | 39.36 | 41.05 | 42.10 | 43.79 | 45.48 | 46.53 | 48.22 |
Numerical data
The following are the details of the technical indicators and moving averages that were collected to generate this technical analysis:
| RSI (14): | 53.60 | |
| MACD (12,26,9): | -0.0700 | |
| Directional Movement: | 2.32 | |
| AROON (14): | -21.43 | |
| DEMA (21): | 43.67 | |
| Parabolic SAR (0,02-0,02-0,2): | 44.93 | |
| Elder Ray (13): | 0.35 | |
| Super Trend (3,10): | 41.73 | |
| Zig ZAG (10): | 44.45 | |
| VORTEX (21): | 0.9300 | |
| Stochastique (14,3,5): | 73.39 | |
| TEMA (21): | 43.86 | |
| Williams %R (14): | -22.26 | |
| Chande Momentum Oscillator (20): | 0.81 | |
| Repulse (5,40,3): | 2.4200 | |
| ROCnROLL: | 1 | |
| TRIX (15,9): | -0.0400 | |
| Courbe Coppock: | 0.93 |
| MA7: | 43.62 | |
| MA20: | 43.88 | |
| MA50: | 44.03 | |
| MA100: | 45.44 | |
| MAexp7: | 43.85 | |
| MAexp20: | 43.81 | |
| MAexp50: | 44.20 | |
| MAexp100: | 44.58 | |
| Price / MA7: | +1.90% | |
| Price / MA20: | +1.30% | |
| Price / MA50: | +0.95% | |
| Price / MA100: | -2.18% | |
| Price / MAexp7: | +1.37% | |
| Price / MAexp20: | +1.46% | |
| Price / MAexp50: | +0.57% | |
| Price / MAexp100: | -0.29% |
News
The last news published on QIAGEN NV EO -.01 at the time of the generation of this analysis was as follows:
- IGI Inex Holding (UK) Becomes Strategic Investor in Quantumrock, Cementing Partnership Between Leading Global Investment Group and AI Asset Tech Frontrunners
- DGAP-Adhoc: QIAGEN N.V.: QIAGEN increases full-year 2022 outlook
- DGAP-Adhoc: QIAGEN N.V.: QIAGEN increases full-year 2022 outlook
- DGAP-Adhoc: QIAGEN N.V.: QIAGEN announces preliminary Q2 2021 results and updates 2021 outlook
- DGAP-Adhoc: QIAGEN N.V.: QIAGEN to conduct an additional up to USD 100 million share repurchase program
About author
Online


Add a comment
Comments
0 comments on the analysis QIAGEN NV EO -.01 - Daily