SENSEONICS HOLDINGS INC. - Daily - Technical analysis published on 04/18/2024 (GMT)
- 179
- 0
Click here for a new analysis!
- Timeframe : Daily
- - Analysis generated on
- Status : INVALID
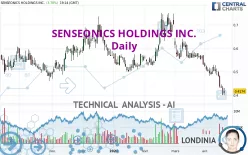

Summary of the analysis

Additional analysis
Quotes
SENSEONICS HOLDINGS INC. rating 0.4174 USD. On the day, this instrument gained +3.78% and was between 0.4000 USD and 0.4298 USD. This implies that the price is at +4.35% from its lowest and at -2.89% from its highest.The Central Gaps scanner detects a bullish opening. A small advantage for buyers in the very short term.
Bullish opening
Type : Bullish
Timeframe : Openning
So that you have an overall view of the price change, here is a table showing the variations over several periods:
New LOW record (1 year)
Type : Bearish
Timeframe : Weekly
New LOW record (1st january)
Type : Bearish
Timeframe : Weekly
New LOW record (1 month)
Type : Bearish
Timeframe : Weekly
Technical
A technical analysis in Daily of this SENSEONICS HOLDINGS INC. chart shows a sharp bearish trend. 92.86% of the signals given by moving averages are bearish. This strongly bearish trend is supported by the strong bearish signals given by short-term moving averages. The Central Indicators market scanner currently does not detect any result that concerns moving averages.
In fact, according to the parameters integrated into the Central Analyzer system, 12 technical indicators out of 18 analysed are currently bearish. But beware of excesses. The Central Indicators scanner currently detects this:
CCI indicator is oversold : under -100
Type : Neutral
Timeframe : Daily
Previous candle closed under Bollinger bands
Type : Neutral
Timeframe : Daily
CCI indicator: bullish divergence
Type : Bullish
Timeframe : Daily
Williams %R indicator is oversold : under -80
Type : Neutral
Timeframe : Daily
Pivot points : price is under support 3
Type : Neutral
Timeframe : Weekly
Price is back over the pivot point
Type : Bullish
Timeframe : Daily
The Central Patterns scanner, which studies chart patterns, resistances and supports, has identified these signals:
Near horizontal support
Type : Bullish
Timeframe : Daily
Support of channel is broken
Type : Bearish
Timeframe : Daily
For a small rebound in the very short term, the Central Candlesticks scanner currently notes the presence of this bullish pattern in Japanese candlesticks:
Bullish harami
Type : Bullish
Timeframe : Daily
| S1 | Price | R1 | R2 | R3 | |
|---|---|---|---|---|---|
| ProTrendLines | 0.3612 | 0.4174 | 0.5011 | 0.5772 | 0.7293 |
| Change (%) | -13.46% | - | +20.05% | +38.28% | +74.72% |
| Change | -0.0562 | - | +0.0837 | +0.1598 | +0.3119 |
| Level | Intermediate | - | Major | Minor | Intermediate |
Attention could also be paid to pivot points to set price objectives:
| Pivot points | S3 | S2 | S1 | PP | R1 | R2 | R3 |
|---|---|---|---|---|---|---|---|
| Standard | 0.3481 | 0.3741 | 0.3881 | 0.4141 | 0.4281 | 0.4541 | 0.4681 |
| Camarilla | 0.3912 | 0.3949 | 0.3985 | 0.4022 | 0.4059 | 0.4095 | 0.4132 |
| Woodie | 0.3422 | 0.3711 | 0.3822 | 0.4111 | 0.4222 | 0.4511 | 0.4622 |
| Fibonacci | 0.3741 | 0.3894 | 0.3988 | 0.4141 | 0.4294 | 0.4388 | 0.4541 |
| Pivot points | S3 | S2 | S1 | PP | R1 | R2 | R3 |
|---|---|---|---|---|---|---|---|
| Standard | 0.4140 | 0.4470 | 0.4640 | 0.4970 | 0.5140 | 0.5470 | 0.5640 |
| Camarilla | 0.4673 | 0.4718 | 0.4764 | 0.4810 | 0.4856 | 0.4902 | 0.4948 |
| Woodie | 0.4060 | 0.4430 | 0.4560 | 0.4930 | 0.5060 | 0.5430 | 0.5560 |
| Fibonacci | 0.4470 | 0.4661 | 0.4779 | 0.4970 | 0.5161 | 0.5279 | 0.5470 |
| Pivot points | S3 | S2 | S1 | PP | R1 | R2 | R3 |
|---|---|---|---|---|---|---|---|
| Standard | 0.3774 | 0.4537 | 0.4924 | 0.5687 | 0.6074 | 0.6837 | 0.7224 |
| Camarilla | 0.4995 | 0.5100 | 0.5206 | 0.5311 | 0.5416 | 0.5522 | 0.5627 |
| Woodie | 0.3586 | 0.4443 | 0.4736 | 0.5593 | 0.5886 | 0.6743 | 0.7036 |
| Fibonacci | 0.4537 | 0.4976 | 0.5248 | 0.5687 | 0.6126 | 0.6398 | 0.6837 |
Numerical data
The following is the status of technical indicators and moving averages registered at the time this technical analysis was created:
| RSI (14): | 29.58 | |
| MACD (12,26,9): | -0.0405 | |
| Directional Movement: | -24.4439 | |
| AROON (14): | -92.8571 | |
| DEMA (21): | 0.4441 | |
| Parabolic SAR (0,02-0,02-0,2): | 0.5100 | |
| Elder Ray (13): | -0.0565 | |
| Super Trend (3,10): | 0.5074 | |
| Zig ZAG (10): | 0.4180 | |
| VORTEX (21): | 0.7110 | |
| Stochastique (14,3,5): | 4.74 | |
| TEMA (21): | 0.4213 | |
| Williams %R (14): | -86.51 | |
| Chande Momentum Oscillator (20): | -0.0911 | |
| Repulse (5,40,3): | -11.2358 | |
| ROCnROLL: | 2 | |
| TRIX (15,9): | -0.8333 | |
| Courbe Coppock: | 35.33 |
| MA7: | 0.4533 | |
| MA20: | 0.5034 | |
| MA50: | 0.5716 | |
| MA100: | 0.5758 | |
| MAexp7: | 0.4451 | |
| MAexp20: | 0.4936 | |
| MAexp50: | 0.5393 | |
| MAexp100: | 0.5641 | |
| Price / MA7: | -7.92% | |
| Price / MA20: | -17.08% | |
| Price / MA50: | -26.98% | |
| Price / MA100: | -27.51% | |
| Price / MAexp7: | -6.22% | |
| Price / MAexp20: | -15.44% | |
| Price / MAexp50: | -22.60% | |
| Price / MAexp100: | -26.01% |
News
Don't forget to follow the news on SENSEONICS HOLDINGS INC.. At the time of publication of this analysis, the latest news was as follows:
- Thinking about buying stock in Senseonics Holdings, Ainos, Marpai, Rush Street Interactive, or Evgo?
- Senseonics Holdings, Inc. Reports Second Quarter 2023 Financial Results
- Senseonics Holdings, Inc. Schedules Second Quarter 2023 Earnings Release and Conference Call for August 10, 2023 at 4:30 p.m. Eastern Time
- Senseonics Announces Equity Grants To Employees Under Inducement Plan
- New Clinical Data Demonstrating the Safety and Accuracy of Eversense through 365 Days Presented at the American Diabetes Association 83rd Scientific Sessions
About author
Online


Add a comment
Comments
0 comments on the analysis SENSEONICS HOLDINGS INC. - Daily