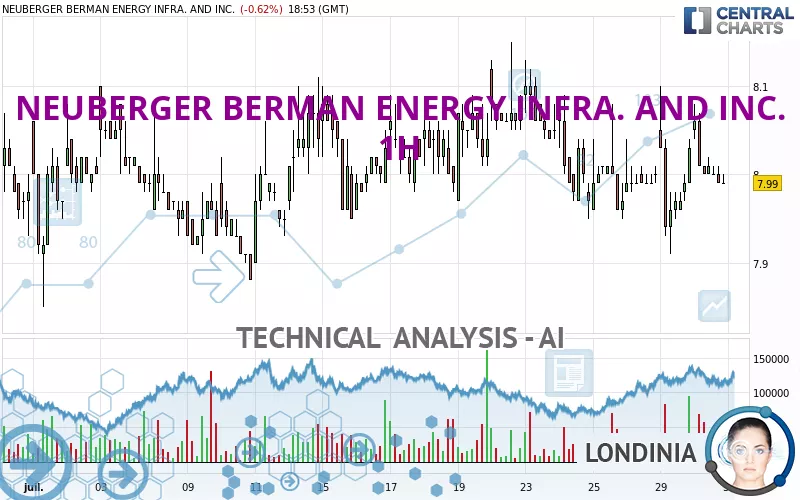
NEUBERGER BERMAN ENERGY INFRA. AND INC. - 1H - Technical analysis published on 07/30/2024 (GMT)
- 194
- 0
- Timeframe : 1H
- - Analysis generated on
- Status : NEUTRAL

Summary of the analysis

Additional analysis
Quotes
The NEUBERGER BERMAN ENERGY INFRA. AND INC. price is 8.00 USD. On the day, this instrument lost -0.50% and was between 8.00 USD and 8.08 USD. This implies that the price is at 0% from its lowest and at -0.99% from its highest.A study of price movements over other periods shows the following variations:
Near a new HIGH record (5 years)
Type : Bullish
Timeframe : Weekly
Near a new HIGH record (1 year)
Type : Bullish
Timeframe : Weekly
Near a new HIGH record (1st january)
Type : Bullish
Timeframe : Weekly
Near a new LOW record (1 month)
Type : Bearish
Timeframe : Weekly
Technical
Technical analysis of this 1H chart of NEUBERGER BERMAN ENERGY INFRA. AND INC. indicates that the overall trend is not clearly defined. This indecision is confirmed by the neutral signals currently given by short-term moving averages. The Central Indicators market scanner currently does not detect any result that concerns moving averages.
In fact, of the 18 technical indicators analysed by Central Analyzer, 6 are bullish, 8 are neutral and 4 are bearish. Other results related to technical indicators were also found by the Central Indicators scanner:
RSI indicator is back over 50
Type : Bullish
Timeframe : 1 hour
MACD indicator is back under 0
Type : Bearish
Timeframe : 1 hour
Price is back under the pivot point
Type : Bearish
Timeframe : Weekly
Momentum indicator is back under 0
Type : Bearish
Timeframe : 1 hour
The Central Patterns scanner, which studies chart patterns, resistances and supports, has identified these signals:
Near resistance of channel
Type : Bearish
Timeframe : 1 hour
Near resistance of triangle
Type : Bearish
Timeframe : 1 hour
The Central Candlesticks scanner, specialised in Japanese candlesticks, did not identify any signals.
| S3 | S2 | S1 | Price | R1 | R2 | R3 | |
|---|---|---|---|---|---|---|---|
| ProTrendLines | 7.69 | 7.86 | 7.91 | 8.00 | 8.10 | 8.15 | 9.70 |
| Change (%) | -3.88% | -1.75% | -1.13% | - | +1.25% | +1.88% | +21.25% |
| Change | -0.31 | -0.14 | -0.09 | - | +0.10 | +0.15 | +1.70 |
| Level | Minor | Major | Intermediate | - | Major | Minor | Minor |
Attention could also be paid to pivot points to set price objectives:
| Pivot points | S3 | S2 | S1 | PP | R1 | R2 | R3 |
|---|---|---|---|---|---|---|---|
| Standard | 7.74 | 7.83 | 7.93 | 8.02 | 8.12 | 8.21 | 8.31 |
| Camarilla | 7.99 | 8.01 | 8.02 | 8.04 | 8.06 | 8.08 | 8.09 |
| Woodie | 7.76 | 7.83 | 7.95 | 8.02 | 8.14 | 8.21 | 8.33 |
| Fibonacci | 7.83 | 7.90 | 7.94 | 8.02 | 8.09 | 8.13 | 8.21 |
| Pivot points | S3 | S2 | S1 | PP | R1 | R2 | R3 |
|---|---|---|---|---|---|---|---|
| Standard | 7.73 | 7.84 | 7.93 | 8.04 | 8.13 | 8.24 | 8.33 |
| Camarilla | 7.97 | 7.98 | 8.00 | 8.02 | 8.04 | 8.06 | 8.08 |
| Woodie | 7.72 | 7.84 | 7.92 | 8.04 | 8.12 | 8.24 | 8.32 |
| Fibonacci | 7.84 | 7.92 | 7.96 | 8.04 | 8.12 | 8.16 | 8.24 |
| Pivot points | S3 | S2 | S1 | PP | R1 | R2 | R3 |
|---|---|---|---|---|---|---|---|
| Standard | 6.94 | 7.17 | 7.56 | 7.79 | 8.18 | 8.41 | 8.80 |
| Camarilla | 7.78 | 7.84 | 7.89 | 7.95 | 8.01 | 8.06 | 8.12 |
| Woodie | 7.02 | 7.21 | 7.64 | 7.83 | 8.26 | 8.45 | 8.88 |
| Fibonacci | 7.17 | 7.41 | 7.55 | 7.79 | 8.03 | 8.17 | 8.41 |
Numerical data
The following are the details of the technical indicators and moving averages that were collected to generate this technical analysis:
| RSI (14): | 49.42 | |
| MACD (12,26,9): | 0.0000 | |
| Directional Movement: | 11.80 | |
| AROON (14): | -14.28 | |
| DEMA (21): | 8.00 | |
| Parabolic SAR (0,02-0,02-0,2): | 7.93 | |
| Elder Ray (13): | 0.01 | |
| Super Trend (3,10): | 8.09 | |
| Zig ZAG (10): | 8.00 | |
| VORTEX (21): | 0.9900 | |
| Stochastique (14,3,5): | 48.32 | |
| TEMA (21): | 8.01 | |
| Williams %R (14): | -52.91 | |
| Chande Momentum Oscillator (20): | -0.03 | |
| Repulse (5,40,3): | -0.1400 | |
| ROCnROLL: | 1 | |
| TRIX (15,9): | -0.0100 | |
| Courbe Coppock: | 0.52 |
| MA7: | 8.03 | |
| MA20: | 7.99 | |
| MA50: | 7.77 | |
| MA100: | 7.46 | |
| MAexp7: | 8.00 | |
| MAexp20: | 8.00 | |
| MAexp50: | 8.01 | |
| MAexp100: | 7.99 | |
| Price / MA7: | -0.37% | |
| Price / MA20: | +0.13% | |
| Price / MA50: | +2.96% | |
| Price / MA100: | +7.24% | |
| Price / MAexp7: | -0% | |
| Price / MAexp20: | -0% | |
| Price / MAexp50: | -0.12% | |
| Price / MAexp100: | +0.13% |
News
The latest news and videos published on NEUBERGER BERMAN ENERGY INFRA. AND INC. at the time of the analysis were as follows:
- Neuberger Berman MLP Income Fund Announces Portfolio Manager Update Call Thursday, November 29, 2018
- Neuberger Berman MLP Income Fund Announces Monthly Distributions
- Neuberger Berman MLP Income Fund Announces Monthly Distributions
- Neuberger Berman MLP Income Fund To Provide Fund Update Thursday, May 10, 2018
- Neuberger Berman MLP Income Fund Announces Monthly Distributions
About author
Online


Add a comment
Comments
0 comments on the analysis NEUBERGER BERMAN ENERGY INFRA. AND INC. - 1H