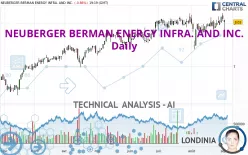
NEUBERGER BERMAN ENERGY INFRA. AND INC. - Daily - Technical analysis published on 09/03/2024 (GMT)
- 138
- 0
Click here for a new analysis!
- Timeframe : Daily
- - Analysis generated on
- Status : LEVEL MAINTAINED

Summary of the analysis

Additional analysis
Quotes
NEUBERGER BERMAN ENERGY INFRA. AND INC. rating 8.02 USD. The price is lower by -0.99% since the last closing and was traded between 7.84 USD and 8.08 USD over the period. The price is currently at +2.30% from its lowest and -0.74% from its highest.The Central Gaps scanner detects a bearish opening. A small advantage for sellers in the very short term.
Bearish opening
Type : Bearish
Timeframe : Openning
Here is a more detailed summary of the historical variations registered by NEUBERGER BERMAN ENERGY INFRA. AND INC.:
Near a new HIGH record (5 years)
Type : Bullish
Timeframe : Weekly
Near a new HIGH record (1 year)
Type : Bullish
Timeframe : Weekly
Near a new HIGH record (1st january)
Type : Bullish
Timeframe : Weekly
Near a new HIGH record (1 month)
Type : Bullish
Timeframe : Weekly
Technical
Technical analysis of NEUBERGER BERMAN ENERGY INFRA. AND INC. in Daily shows a strongly overall bullish trend. 92.86% of the signals given by moving averages are bullish. This strongly bullish trend is supported by the strong bullish signals given by short-term moving averages. The Central Indicators market scanner currently does not detect any result that concerns moving averages.
In fact, 11 technical indicators on 18 studied are currently positioned bullish. Central Indicators, the detector scanner for these technical indicators recently detected a signal:
Parabolic SAR indicator bearish reversal
Type : Bearish
Timeframe : Daily
Central Patterns, the market scanner focusing on chart patterns, resistances and supports found this result:
Near support of channel
Type : Bullish
Timeframe : Daily
No result was found by the Central Candlesticks scanner on Japanese candlesticks.
| S3 | S2 | S1 | Price | R1 | R2 | R3 | |
|---|---|---|---|---|---|---|---|
| ProTrendLines | 6.54 | 6.72 | 7.42 | 8.02 | 8.04 | 9.62 | 15.90 |
| Change (%) | -18.45% | -16.21% | -7.48% | - | +0.25% | +19.95% | +98.25% |
| Change | -1.48 | -1.30 | -0.60 | - | +0.02 | +1.60 | +7.88 |
| Level | Minor | Major | Minor | - | Major | Minor | Intermediate |
To determine price objectives, it is also possible to use the pivot points. Here is the price position in relation to pivot points:
| Pivot points | S3 | S2 | S1 | PP | R1 | R2 | R3 |
|---|---|---|---|---|---|---|---|
| Standard | 7.83 | 7.94 | 8.02 | 8.13 | 8.21 | 8.32 | 8.40 |
| Camarilla | 8.05 | 8.07 | 8.08 | 8.10 | 8.12 | 8.14 | 8.15 |
| Woodie | 7.82 | 7.93 | 8.01 | 8.12 | 8.20 | 8.31 | 8.39 |
| Fibonacci | 7.94 | 8.01 | 8.06 | 8.13 | 8.20 | 8.25 | 8.32 |
| Pivot points | S3 | S2 | S1 | PP | R1 | R2 | R3 |
|---|---|---|---|---|---|---|---|
| Standard | 7.61 | 7.77 | 7.93 | 8.09 | 8.25 | 8.41 | 8.57 |
| Camarilla | 8.01 | 8.04 | 8.07 | 8.10 | 8.13 | 8.16 | 8.19 |
| Woodie | 7.62 | 7.77 | 7.94 | 8.09 | 8.26 | 8.41 | 8.58 |
| Fibonacci | 7.77 | 7.89 | 7.96 | 8.09 | 8.21 | 8.28 | 8.41 |
| Pivot points | S3 | S2 | S1 | PP | R1 | R2 | R3 |
|---|---|---|---|---|---|---|---|
| Standard | 6.65 | 6.99 | 7.55 | 7.89 | 8.45 | 8.79 | 9.35 |
| Camarilla | 7.85 | 7.94 | 8.02 | 8.10 | 8.18 | 8.27 | 8.35 |
| Woodie | 6.75 | 7.05 | 7.65 | 7.95 | 8.55 | 8.85 | 9.45 |
| Fibonacci | 6.99 | 7.34 | 7.55 | 7.89 | 8.24 | 8.45 | 8.79 |
Numerical data
The following is the status of technical indicators and moving averages registered at the time this technical analysis was created:
| RSI (14): | 53.37 | |
| MACD (12,26,9): | 0.0600 | |
| Directional Movement: | 3.03 | |
| AROON (14): | 92.86 | |
| DEMA (21): | 8.03 | |
| Parabolic SAR (0,02-0,02-0,2): | 8.24 | |
| Elder Ray (13): | -0.03 | |
| Super Trend (3,10): | 7.65 | |
| Zig ZAG (10): | 8.03 | |
| VORTEX (21): | 1.0300 | |
| Stochastique (14,3,5): | 76.07 | |
| TEMA (21): | 8.05 | |
| Williams %R (14): | -42.00 | |
| Chande Momentum Oscillator (20): | 0.09 | |
| Repulse (5,40,3): | 0.0100 | |
| ROCnROLL: | 1 | |
| TRIX (15,9): | 0.0700 | |
| Courbe Coppock: | 5.83 |
| MA7: | 8.03 | |
| MA20: | 7.92 | |
| MA50: | 7.90 | |
| MA100: | 7.63 | |
| MAexp7: | 8.03 | |
| MAexp20: | 7.96 | |
| MAexp50: | 7.85 | |
| MAexp100: | 7.62 | |
| Price / MA7: | -0.12% | |
| Price / MA20: | +1.26% | |
| Price / MA50: | +1.52% | |
| Price / MA100: | +5.11% | |
| Price / MAexp7: | -0.12% | |
| Price / MAexp20: | +0.75% | |
| Price / MAexp50: | +2.17% | |
| Price / MAexp100: | +5.25% |
News
The last news published on NEUBERGER BERMAN ENERGY INFRA. AND INC. at the time of the generation of this analysis was as follows:
- Neuberger Berman MLP Income Fund Announces Portfolio Manager Update Call Thursday, November 29, 2018
- Neuberger Berman MLP Income Fund Announces Monthly Distributions
- Neuberger Berman MLP Income Fund Announces Monthly Distributions
- Neuberger Berman MLP Income Fund To Provide Fund Update Thursday, May 10, 2018
- Neuberger Berman MLP Income Fund Announces Monthly Distributions
About author
Online


Add a comment
Comments
0 comments on the analysis NEUBERGER BERMAN ENERGY INFRA. AND INC. - Daily