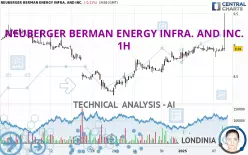
NEUBERGER BERMAN ENERGY INFRA. AND INC. - 1H - Technical analysis published on 01/08/2025 (GMT)
- 94
- 0
Click here for a new analysis!
- Timeframe : 1H
- - Analysis generated on
- Status : TARGET REACHED

Summary of the analysis

Additional analysis
Quotes
NEUBERGER BERMAN ENERGY INFRA. AND INC. rating 8.94 USD. The price registered a decrease of -0.11% on the session and was between 8.90 USD and 9.51 USD. This implies that the price is at +0.45% from its lowest and at -5.99% from its highest.A bullish opening was detected by the Central Gaps scanner. Buyers are trying to impose a bullish momentum in the very short term.
Bullish opening
Type : Bullish
Timeframe : Openning
So that you have an overall view of the price change, here is a table showing the variations over several periods:
Near a new HIGH record (5 years)
Type : Bullish
Timeframe : Weekly
Near a new HIGH record (1 year)
Type : Bullish
Timeframe : Weekly
Near a new LOW record (1st january)
Type : Bearish
Timeframe : Weekly
Near a new HIGH record (1 month)
Type : Bullish
Timeframe : Weekly
Technical
Technical analysis of this 1H chart of NEUBERGER BERMAN ENERGY INFRA. AND INC. indicates that the overall trend is strongly bullish. 92.86% of the signals given by moving averages are bullish. This strongly bullish trend is supported by the strong bullish signals given by short-term moving averages. The Central Indicators market scanner is currently detecting a bullish signal that could impact this trend:
Bullish price crossover with Moving Average 20
Type : Bullish
Timeframe : 1 hour
An assessment of technical indicators shows a moderate bullish signal.
Other results related to technical indicators were also found by the Central Indicators scanner:
Parabolic SAR indicator bullish reversal
Type : Bullish
Timeframe : 1 hour
Price is back over the pivot point
Type : Bullish
Timeframe : 1 hour
Momentum indicator is back over 0
Type : Bullish
Timeframe : 1 hour
An analysis of the price chart with the Central Patterns scanner (detector of chart patterns and resistances and supports) shows several results that can have an impact on the price change:
Near resistance of channel
Type : Bearish
Timeframe : 1 hour
Near resistance of triangle
Type : Bearish
Timeframe : 1 hour
The Central Candlesticks scanner, specialised in Japanese candlesticks, did not identify any signals.
| S3 | S2 | S1 | R1 | Price | R2 | R3 | |
|---|---|---|---|---|---|---|---|
| ProTrendLines | 8.20 | 8.56 | 8.81 | 8.94 | 8.94 | 9.03 | 9.16 |
| Change (%) | -8.28% | -4.25% | -1.45% | 0% | - | +1.01% | +2.46% |
| Change | -0.74 | -0.38 | -0.13 | 0 | - | +0.09 | +0.22 |
| Level | Minor | Minor | Minor | Intermediate | - | Minor | Minor |
Attention could also be paid to pivot points to set price objectives:
| Pivot points | S3 | S2 | S1 | PP | R1 | R2 | R3 |
|---|---|---|---|---|---|---|---|
| Standard | 8.66 | 8.74 | 8.84 | 8.92 | 9.02 | 9.10 | 9.20 |
| Camarilla | 8.90 | 8.92 | 8.93 | 8.95 | 8.97 | 8.98 | 9.00 |
| Woodie | 8.68 | 8.75 | 8.86 | 8.93 | 9.04 | 9.11 | 9.22 |
| Fibonacci | 8.74 | 8.81 | 8.85 | 8.92 | 8.99 | 9.03 | 9.10 |
| Pivot points | S3 | S2 | S1 | PP | R1 | R2 | R3 |
|---|---|---|---|---|---|---|---|
| Standard | 8.21 | 8.38 | 8.65 | 8.82 | 9.09 | 9.26 | 9.53 |
| Camarilla | 8.79 | 8.83 | 8.87 | 8.91 | 8.95 | 8.99 | 9.03 |
| Woodie | 8.25 | 8.41 | 8.69 | 8.85 | 9.13 | 9.29 | 9.57 |
| Fibonacci | 8.38 | 8.55 | 8.66 | 8.82 | 8.99 | 9.10 | 9.26 |
| Pivot points | S3 | S2 | S1 | PP | R1 | R2 | R3 |
|---|---|---|---|---|---|---|---|
| Standard | 7.02 | 7.61 | 8.22 | 8.81 | 9.42 | 10.01 | 10.62 |
| Camarilla | 8.50 | 8.61 | 8.72 | 8.83 | 8.94 | 9.05 | 9.16 |
| Woodie | 7.03 | 7.62 | 8.23 | 8.82 | 9.43 | 10.02 | 10.63 |
| Fibonacci | 7.61 | 8.07 | 8.35 | 8.81 | 9.27 | 9.55 | 10.01 |
Numerical data
The following is the status of the technical indicators and moving averages at the time of publication of this technical analysis:
| RSI (14): | 60.09 | |
| MACD (12,26,9): | 0.0200 | |
| Directional Movement: | 12.31 | |
| AROON (14): | -57.15 | |
| DEMA (21): | 8.95 | |
| Parabolic SAR (0,02-0,02-0,2): | 8.81 | |
| Elder Ray (13): | 0.03 | |
| Super Trend (3,10): | 8.79 | |
| Zig ZAG (10): | 8.95 | |
| VORTEX (21): | 0.9800 | |
| Stochastique (14,3,5): | 61.11 | |
| TEMA (21): | 8.93 | |
| Williams %R (14): | -22.22 | |
| Chande Momentum Oscillator (20): | 0.03 | |
| Repulse (5,40,3): | -0.0600 | |
| ROCnROLL: | 1 | |
| TRIX (15,9): | 0.0600 | |
| Courbe Coppock: | 0.46 |
| MA7: | 8.84 | |
| MA20: | 8.74 | |
| MA50: | 8.78 | |
| MA100: | 8.38 | |
| MAexp7: | 8.92 | |
| MAexp20: | 8.91 | |
| MAexp50: | 8.84 | |
| MAexp100: | 8.80 | |
| Price / MA7: | +1.13% | |
| Price / MA20: | +2.29% | |
| Price / MA50: | +1.82% | |
| Price / MA100: | +6.68% | |
| Price / MAexp7: | +0.22% | |
| Price / MAexp20: | +0.34% | |
| Price / MAexp50: | +1.13% | |
| Price / MAexp100: | +1.59% |
News
Don't forget to follow the news on NEUBERGER BERMAN ENERGY INFRA. AND INC.. At the time of publication of this analysis, the latest news was as follows:
- Neuberger Berman MLP Income Fund Announces Portfolio Manager Update Call Thursday, November 29, 2018
- Neuberger Berman MLP Income Fund Announces Monthly Distributions
- Neuberger Berman MLP Income Fund Announces Monthly Distributions
- Neuberger Berman MLP Income Fund To Provide Fund Update Thursday, May 10, 2018
- Neuberger Berman MLP Income Fund Announces Monthly Distributions
About author
Online


Add a comment
Comments
0 comments on the analysis NEUBERGER BERMAN ENERGY INFRA. AND INC. - 1H