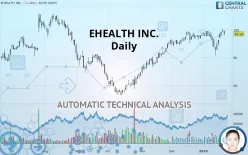
EHEALTH INC. - Daily - Technical analysis published on 01/24/2020 (GMT)
- 381
- 0
- Who voted?
Click here for a new analysis!
- Timeframe : Daily
- - Analysis generated on
- Status : TARGET REACHED

Summary of the analysis

Additional analysis
Quotes
The EHEALTH INC. price is 97.13 USD. The price has increased by -2.48% since the last closing and was traded between 96.11 USD and 99.31 USD over the period. The price is currently at +1.06% from its lowest and -2.20% from its highest.A bearish opening was detected by the Central Gaps scanner. Sellers are trying to impose a bearish trend in the very short term.
Bearish opening
Type : Bearish
Timeframe : Openning
Here is a more detailed summary of the historical variations registered by EHEALTH INC.:
Near a new HIGH record (1st january)
Type : Bullish
Timeframe : Weekly
Near a new HIGH record (1 month)
Type : Bullish
Timeframe : Weekly
Technical
Technical analysis of this Daily chart of EHEALTH INC. indicates that the overall trend is strongly bullish. 92.86% of the signals given by moving averages are bullish. The overall trend is supported by the strong bullish signals from short-term moving averages. The Central Indicators scanner does not detect any result on moving averages that would impact this trend.
The technical indicators are bullish. There is still some doubt about the price increase.
Caution: the Central Indicators scanner currently detects an excess:
CCI indicator is overbought : over 100
Type : Neutral
Timeframe : Daily
Williams %R indicator is overbought : over -20
Type : Neutral
Timeframe : Daily
Pivot points : price is under support 1
Type : Neutral
Timeframe : Daily
MACD crosses UP its Moving Average
Type : Bullish
Timeframe : Daily
Aroon indicator bullish trend
Type : Bullish
Timeframe : Daily
Price is back over the pivot point
Type : Bullish
Timeframe : Daily
Central Patterns, the market scanner focusing on chart patterns, resistances and supports found this result:
Resistance of triangle is broken
Type : Bullish
Timeframe : Daily
The Central Candlesticks scanner which studies Japanese candlesticks did not detect anything.
| S3 | S2 | S1 | Price | R1 | R2 | R3 | |
|---|---|---|---|---|---|---|---|
| ProTrendLines | 70.08 | 85.48 | 93.41 | 97.13 | 99.00 | 105.78 | 110.32 |
| Change (%) | -27.85% | -11.99% | -3.83% | - | +1.93% | +8.91% | +13.58% |
| Change | -27.05 | -11.65 | -3.72 | - | +1.87 | +8.65 | +13.19 |
| Level | Minor | Intermediate | Major | - | Major | Minor | Major |
To determine price objectives, it is also possible to use the pivot points. Here is the price position in relation to pivot points:
| Pivot points | S3 | S2 | S1 | PP | R1 | R2 | R3 |
|---|---|---|---|---|---|---|---|
| Standard | 95.68 | 96.99 | 98.29 | 99.60 | 100.90 | 102.21 | 103.51 |
| Camarilla | 98.88 | 99.12 | 99.36 | 99.60 | 99.84 | 100.08 | 100.32 |
| Woodie | 95.69 | 96.99 | 98.30 | 99.60 | 100.91 | 102.21 | 103.52 |
| Fibonacci | 96.99 | 97.98 | 98.60 | 99.60 | 100.59 | 101.21 | 102.21 |
| Pivot points | S3 | S2 | S1 | PP | R1 | R2 | R3 |
|---|---|---|---|---|---|---|---|
| Standard | 71.10 | 76.44 | 86.62 | 91.96 | 102.14 | 107.48 | 117.66 |
| Camarilla | 92.54 | 93.97 | 95.39 | 96.81 | 98.23 | 99.66 | 101.08 |
| Woodie | 73.53 | 77.65 | 89.05 | 93.17 | 104.57 | 108.69 | 120.09 |
| Fibonacci | 76.44 | 82.37 | 86.03 | 91.96 | 97.89 | 101.55 | 107.48 |
| Pivot points | S3 | S2 | S1 | PP | R1 | R2 | R3 |
|---|---|---|---|---|---|---|---|
| Standard | 78.17 | 83.04 | 89.56 | 94.43 | 100.95 | 105.82 | 112.34 |
| Camarilla | 92.95 | 93.99 | 95.04 | 96.08 | 97.12 | 98.17 | 99.21 |
| Woodie | 79.00 | 83.45 | 90.39 | 94.84 | 101.77 | 106.23 | 113.16 |
| Fibonacci | 83.04 | 87.39 | 90.08 | 94.43 | 98.78 | 101.47 | 105.82 |
Numerical data
The following is the status of technical indicators and moving averages registered at the time this technical analysis was created:
| RSI (14): | 56.42 | |
| MACD (12,26,9): | 1.4000 | |
| Directional Movement: | 3.86 | |
| AROON (14): | 35.72 | |
| DEMA (21): | 96.49 | |
| Parabolic SAR (0,02-0,02-0,2): | 83.84 | |
| Elder Ray (13): | 2.66 | |
| Super Trend (3,10): | 87.90 | |
| Zig ZAG (10): | 97.13 | |
| VORTEX (21): | 0.9800 | |
| Stochastique (14,3,5): | 90.13 | |
| TEMA (21): | 95.26 | |
| Williams %R (14): | -19.71 | |
| Chande Momentum Oscillator (20): | -1.87 | |
| Repulse (5,40,3): | 1.4100 | |
| ROCnROLL: | 1 | |
| TRIX (15,9): | 0.1800 | |
| Courbe Coppock: | 2.73 |
| MA7: | 94.23 | |
| MA20: | 94.89 | |
| MA50: | 91.04 | |
| MA100: | 80.01 | |
| MAexp7: | 95.93 | |
| MAexp20: | 94.45 | |
| MAexp50: | 90.25 | |
| MAexp100: | 85.52 | |
| Price / MA7: | +3.08% | |
| Price / MA20: | +2.36% | |
| Price / MA50: | +6.69% | |
| Price / MA100: | +21.40% | |
| Price / MAexp7: | +1.25% | |
| Price / MAexp20: | +2.84% | |
| Price / MAexp50: | +7.62% | |
| Price / MAexp100: | +13.58% |
News
The latest news and videos published on EHEALTH INC. at the time of the analysis were as follows:
- eHealth Achieves HITRUST CSF® Certification to Manage Risk, Improve Security Posture and Meet Compliance Requirements
- Digital Health Study: Estonia overtakes Denmark as European eHealth Champion
- Medicare Supplement Enrollees Could Save More Than $1,000 Per Year By Comparison Shopping, According to eHealth Report
- Health Plan Comparison Tools Can Significantly Increase Consumer Confidence, According to eHealth Analysis
- ACA Open Enrollment "Half-Time" Report: Average Individual Premiums Decrease 4%, Deductibles Rise 5%
About author

Online


Add a comment
Comments
0 comments on the analysis EHEALTH INC. - Daily