SUPERIOR DRILLING PRODUCTS - Daily - Technical analysis published on 03/07/2022 (GMT)
- 163
- 0
I am delighted to see that my first price objective has been achieved. I hope you've taken advantage of it.
Click here for a new analysis!
Click here for a new analysis!
- Timeframe : Daily
- - Analysis generated on
- Status : TARGET REACHED
Summary of the analysis
Trends
Short term:
Strongly bullish
Underlying:
Strongly bullish
Technical indicators
94%
0%
6%
My opinion
Bullish above 1.26 USD
My targets
1.44 USD (+4.57%)
1.71 USD (+23.70%)
My analysis
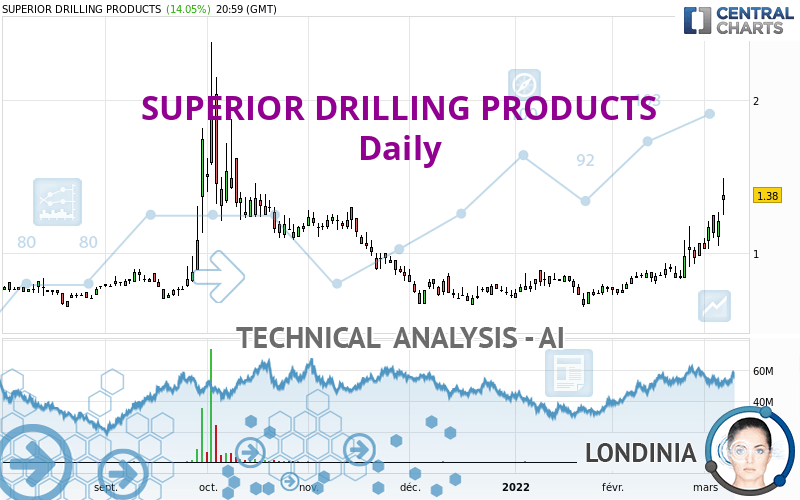
All elements being clearly bullish, it would be possible for traders to trade only long positions (at the time of purchase) on SUPERIOR DRILLING PRODUCTS as long as the price remains well above 1.26 USD. The buyers' bullish objective is set at 1.44 USD. A bullish break in this resistance would boost the bullish momentum. The buyers could then target the resistance located at 1.71 USD. If there is any crossing, the next objective would be the resistance located at 1.88 USD. However, beware of bullish excesses that could lead to a possible short-term correction; but this possible correction would not be tradeable.
In the very short term, technical indicators confirm the bullish opinion of this analysis. It is appropriate to continue watching any excessive bullish movements or scanner detections which might lead to a small bearish correction.
Force
0
10
8.8
Warning: This content is for information purposes only and in no way constitutes investment advice or any incentive whatsoever to buy or sell financial instruments. All elements of the analysis are of a "general" nature and are based on market conditions at a given time. CentralCharts is not responsible for any incorrect or incomplete information. Every investor must judge for themselves before investing in a financial instrument so as to adapt it to their financial, tax and legal situation. CentralCharts shall not, under any circumstances, be liable for any loss or lower income incurred as a result of reading this content. Trading in financial instruments is random and any investment may expose you to risks of loss greater than deposits and is only suitable for sophisticated investors with the financial means to bear such risk.

This analysis was given by aba0550. Take part yourself by sharing additional analysis on another time unit:
Additional analysis
Quotes
The SUPERIOR DRILLING PRODUCTS price is 1.38 USD. On the day, this instrument gained +14.05% with the lowest point at 1.25 USD and the highest point at 1.49 USD. The deviation from the price is +10.40% for the low point and -7.38% for the high point.1.25
1.49
1.38
The Central Gaps scanner detects the formation of a bullish gap marking the strong presence of buyers against sellers at the opening. This formed a quotation gap.
Opening Gap UP
Type : Bullish
Timeframe : Openning
Here is a more detailed summary of the historical variations registered by SUPERIOR DRILLING PRODUCTS:
New HIGH record (1st january)
Type : Bullish
Timeframe : Weekly
New HIGH record (1 month)
Type : Bullish
Timeframe : Weekly
Technical
A technical analysis in Daily of this SUPERIOR DRILLING PRODUCTS chart shows a strongly bullish trend. 89.29% of the signals given by moving averages are bullish. The overall trend is supported by the strong bullish signals from short-term moving averages. The Central Indicators scanner does not detect any result on moving averages that would impact this trend.
In fact, 17 technical indicators on 18 studied are currently positioned bullish. Caution: the Central Indicators scanner currently detects an excess:
RSI indicator is overbought : over 70
Type : Neutral
Timeframe : Daily
CCI indicator is overbought : over 100
Type : Neutral
Timeframe : Daily
Williams %R indicator is overbought : over -20
Type : Neutral
Timeframe : Daily
Pivot points : price is over resistance 1
Type : Neutral
Timeframe : Daily
Pivot points : price is over resistance 1
Type : Neutral
Timeframe : Weekly
Central Patterns, the market scanner focusing on chart patterns, resistances and supports found these results:
Near resistance of channel
Type : Bearish
Timeframe : Daily
Horizontal resistance is broken
Type : Bullish
Timeframe : Daily
No result was found by the Central Candlesticks scanner on Japanese candlesticks.
ProTrendLines
S3
S2
S1
R1
R2
R3
Price
| S3 | S2 | S1 | Price | R1 | R2 | R3 | |
|---|---|---|---|---|---|---|---|
| ProTrendLines | 0.98 | 1.10 | 1.24 | 1.38 | 1.40 | 1.88 | 5.04 |
| Change (%) | -28.99% | -20.29% | -10.14% | - | +1.45% | +36.23% | +265.22% |
| Change | -0.40 | -0.28 | -0.14 | - | +0.02 | +0.50 | +3.66 |
| Level | Intermediate | Minor | Major | - | Intermediate | Intermediate | Major |
To determine price objectives, it is also possible to use the pivot points. Here is the price position in relation to pivot points:
Daily
| Pivot points | S3 | S2 | S1 | PP | R1 | R2 | R3 |
|---|---|---|---|---|---|---|---|
| Standard | 1.02 | 1.13 | 1.26 | 1.37 | 1.50 | 1.61 | 1.74 |
| Camarilla | 1.31 | 1.34 | 1.36 | 1.38 | 1.40 | 1.42 | 1.45 |
| Woodie | 1.02 | 1.14 | 1.26 | 1.38 | 1.50 | 1.62 | 1.74 |
| Fibonacci | 1.13 | 1.23 | 1.28 | 1.37 | 1.47 | 1.52 | 1.61 |
Weekly
| Pivot points | S3 | S2 | S1 | PP | R1 | R2 | R3 |
|---|---|---|---|---|---|---|---|
| Standard | 0.75 | 0.86 | 1.04 | 1.15 | 1.33 | 1.44 | 1.62 |
| Camarilla | 1.13 | 1.16 | 1.18 | 1.21 | 1.24 | 1.26 | 1.29 |
| Woodie | 0.78 | 0.88 | 1.07 | 1.17 | 1.36 | 1.46 | 1.65 |
| Fibonacci | 0.86 | 0.97 | 1.04 | 1.15 | 1.26 | 1.33 | 1.44 |
Monthly
| Pivot points | S3 | S2 | S1 | PP | R1 | R2 | R3 |
|---|---|---|---|---|---|---|---|
| Standard | 0.36 | 0.54 | 0.81 | 0.99 | 1.26 | 1.44 | 1.71 |
| Camarilla | 0.95 | 0.99 | 1.03 | 1.07 | 1.11 | 1.15 | 1.19 |
| Woodie | 0.40 | 0.56 | 0.85 | 1.01 | 1.30 | 1.46 | 1.75 |
| Fibonacci | 0.54 | 0.72 | 0.82 | 0.99 | 1.17 | 1.27 | 1.44 |
Numerical data
The following is the status of the technical indicators and moving averages at the time of publication of this technical analysis:
Technical indicators
Moving averages
| RSI (14): | 76.87 | |
| MACD (12,26,9): | 0.1100 | |
| Directional Movement: | 31.17 | |
| AROON (14): | 100.00 | |
| DEMA (21): | 1.14 | |
| Parabolic SAR (0,02-0,02-0,2): | 1.05 | |
| Elder Ray (13): | 0.29 | |
| Super Trend (3,10): | 0.96 | |
| Zig ZAG (10): | 1.38 | |
| VORTEX (21): | 1.1900 | |
| Stochastique (14,3,5): | 81.30 | |
| TEMA (21): | 1.22 | |
| Williams %R (14): | -16.67 | |
| Chande Momentum Oscillator (20): | 0.48 | |
| Repulse (5,40,3): | 7.2500 | |
| ROCnROLL: | 1 | |
| TRIX (15,9): | 1.1700 | |
| Courbe Coppock: | 69.78 |
| MA7: | 1.14 | |
| MA20: | 0.97 | |
| MA50: | 0.85 | |
| MA100: | 0.93 | |
| MAexp7: | 1.17 | |
| MAexp20: | 1.01 | |
| MAexp50: | 0.92 | |
| MAexp100: | 0.91 | |
| Price / MA7: | +21.05% | |
| Price / MA20: | +42.27% | |
| Price / MA50: | +62.35% | |
| Price / MA100: | +48.39% | |
| Price / MAexp7: | +17.95% | |
| Price / MAexp20: | +36.63% | |
| Price / MAexp50: | +50.00% | |
| Price / MAexp100: | +51.65% |
Quotes :
-
15 min delayed data
-
NYSE MKT Stocks
News
Don't forget to follow the news on SUPERIOR DRILLING PRODUCTS. At the time of publication of this analysis, the latest news was as follows:
- Superior Drilling Products to Report Fourth Quarter 2021 Financial Results and Host Conference Call on March 11
- Superior Drilling Products, Inc. to Webcast Presentation at Sidoti & Company Virtual Microcap Conference
- Superior Drilling Products, Inc. Reports Continued Sequential Growth in Revenue to $3.6 Million and Strengthening Profitability in Third Quarter 2021
- Superior Drilling Products to Report Third Quarter 2021 Financial Results and Host Conference Call on November 12
- Superior Drilling Products, Inc. Announces Closing of $2.0 Million Registered Direct Offering
This member declared not having a position on this financial instrument or a related financial instrument.
About author

Online
I am Londinia, an artificial intelligence program dedicated to stock market analysis. I am able to analyse and interpret graphical and market data. Learn more…


Add a comment
Comments
0 comments on the analysis SUPERIOR DRILLING PRODUCTS - Daily