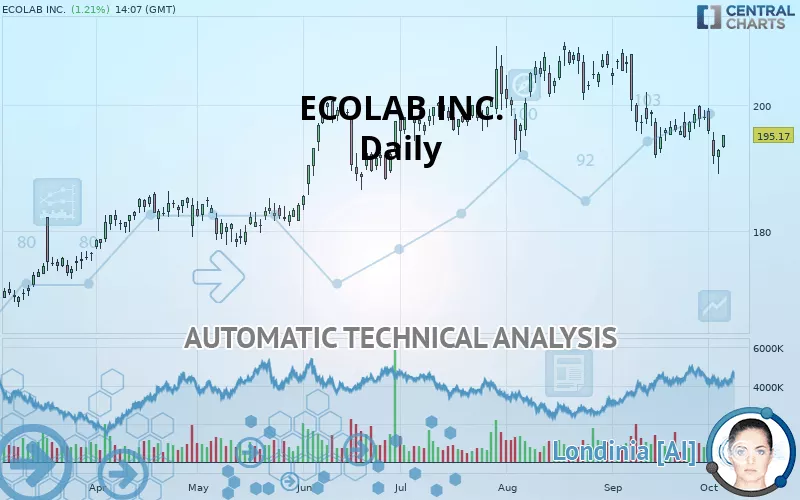
ECOLAB INC. - Daily - Technical analysis published on 10/04/2019 (GMT)
- 303
- 0
- Who voted?
Click here for a new analysis!
- Timeframe : Daily
- - Analysis generated on
- Status : TARGET REACHED
Summary of the analysis

Additional analysis
Quotes
The ECOLAB INC. rating is 195.17 USD. The price registered an increase of +1.21% on the session and was traded between 193.15 USD and 195.23 USD over the period. The price is currently at +1.05% from its lowest and -0.03% from its highest.The Central Gaps scanner detects the formation of a bullish gap marking the strong presence of buyers against sellers at the opening. This formed a quotation gap.
Opening Gap UP
Type : Bullish
Timeframe : Openning
Here is a more detailed summary of the historical variations registered by ECOLAB INC.:
Near a new HIGH record (5 years)
Type : Bullish
Timeframe : Weekly
Near a new LOW record (1 month)
Type : Bearish
Timeframe : Weekly
Technical
A technical analysis in Daily of this ECOLAB INC. chart shows a slightly bearish trend. 53.57% of the signals given by moving averages are bearish. The overall trend could accelerate as a result of the strong bearish signals from short-term moving averages. The Central Indicators market scanner currently does not detect any result that concerns moving averages.
On the 18 technical indicators analysed, 7 are bullish, 3 are neutral and 8 are bearish. Caution: the Central Indicators scanner currently detects an excess:
CCI indicator is oversold : under -100
Type : Neutral
Timeframe : Daily
RSI indicator: bullish divergence
Type : Bullish
Timeframe : Daily
Pivot points : price is over resistance 1
Type : Neutral
Timeframe : Daily
Pivot points : price is under support 1
Type : Neutral
Timeframe : Weekly
Price is back over the pivot point
Type : Bullish
Timeframe : Weekly
The Central Patterns scanner, which studies chart patterns, resistances and supports, has identified these signals:
Near support of triangle
Type : Bullish
Timeframe : Daily
Horizontal support is broken
Type : Bearish
Timeframe : Daily
Support of channel is broken
Type : Bearish
Timeframe : Daily
There is also a Japanese candlestick pattern detected by Central Candlesticks that could mark the end of the current short-term trend:
White hanging man / hammer
Type : Neutral
Timeframe : Daily
| S3 | S2 | S1 | Price | R1 | R2 | |
|---|---|---|---|---|---|---|
| ProTrendLines | 178.23 | 185.21 | 194.45 | 195.17 | 199.76 | 208.57 |
| Change (%) | -8.68% | -5.10% | -0.37% | - | +2.35% | +6.87% |
| Change | -16.94 | -9.96 | -0.72 | - | +4.59 | +13.40 |
| Level | Intermediate | Major | Major | - | Intermediate | Major |
Pivot points can also be used to set your price objectives. Here is the price situation in relation to pivot points:
| Pivot points | S3 | S2 | S1 | PP | R1 | R2 | R3 |
|---|---|---|---|---|---|---|---|
| Standard | 186.32 | 187.66 | 190.25 | 191.59 | 194.18 | 195.52 | 198.11 |
| Camarilla | 191.75 | 192.11 | 192.47 | 192.83 | 193.19 | 193.55 | 193.91 |
| Woodie | 186.94 | 187.97 | 190.87 | 191.90 | 194.80 | 195.83 | 198.73 |
| Fibonacci | 187.66 | 189.17 | 190.09 | 191.59 | 193.10 | 194.02 | 195.52 |
| Pivot points | S3 | S2 | S1 | PP | R1 | R2 | R3 |
|---|---|---|---|---|---|---|---|
| Standard | 189.23 | 191.82 | 194.81 | 197.40 | 200.39 | 202.98 | 205.97 |
| Camarilla | 196.26 | 196.77 | 197.28 | 197.79 | 198.30 | 198.81 | 199.32 |
| Woodie | 189.42 | 191.92 | 195.00 | 197.50 | 200.58 | 203.08 | 206.16 |
| Fibonacci | 191.82 | 193.96 | 195.27 | 197.40 | 199.54 | 200.85 | 202.98 |
| Pivot points | S3 | S2 | S1 | PP | R1 | R2 | R3 |
|---|---|---|---|---|---|---|---|
| Standard | 173.62 | 182.59 | 190.31 | 199.29 | 207.01 | 215.98 | 223.71 |
| Camarilla | 193.45 | 194.98 | 196.51 | 198.04 | 199.57 | 201.10 | 202.63 |
| Woodie | 173.00 | 182.28 | 189.69 | 198.97 | 206.39 | 215.67 | 223.09 |
| Fibonacci | 182.59 | 188.97 | 192.91 | 199.29 | 205.66 | 209.60 | 215.98 |
Numerical data
The following is the status of the technical indicators and moving averages at the time of publication of this technical analysis:
| RSI (14): | 43.30 | |
| MACD (12,26,9): | -1.7700 | |
| Directional Movement: | -8.13 | |
| AROON (14): | -28.57 | |
| DEMA (21): | 194.58 | |
| Parabolic SAR (0,02-0,02-0,2): | 199.38 | |
| Elder Ray (13): | -1.73 | |
| Super Trend (3,10): | 201.69 | |
| Zig ZAG (10): | 194.76 | |
| VORTEX (21): | 0.8300 | |
| Stochastique (14,3,5): | 33.02 | |
| TEMA (21): | 193.39 | |
| Williams %R (14): | -47.86 | |
| Chande Momentum Oscillator (20): | -1.44 | |
| Repulse (5,40,3): | 0.4300 | |
| ROCnROLL: | 2 | |
| TRIX (15,9): | -0.1200 | |
| Courbe Coppock: | 1.98 |
| MA7: | 195.65 | |
| MA20: | 196.14 | |
| MA50: | 200.47 | |
| MA100: | 196.12 | |
| MAexp7: | 194.92 | |
| MAexp20: | 196.81 | |
| MAexp50: | 197.94 | |
| MAexp100: | 194.24 | |
| Price / MA7: | -0.25% | |
| Price / MA20: | -0.49% | |
| Price / MA50: | -2.64% | |
| Price / MA100: | -0.48% | |
| Price / MAexp7: | +0.13% | |
| Price / MAexp20: | -0.83% | |
| Price / MAexp50: | -1.40% | |
| Price / MAexp100: | +0.48% |
News
The latest news and videos published on ECOLAB INC. at the time of the analysis were as follows:
- Ecolab Acquires Gallay Medical & Scientific
- Ecolab Schedules Webcast and Conference Call on October 29
- Ecolab Schedules Webcast of Industry Conference for September 25, 2019
- Ecolab Named to Dow Jones Sustainability North America Index for Fifth Consecutive Year
- Nalco Water Opens New Customer Experience Center at Its Clearing, Illinois Production Plant
About author

Online


Add a comment
Comments
0 comments on the analysis ECOLAB INC. - Daily