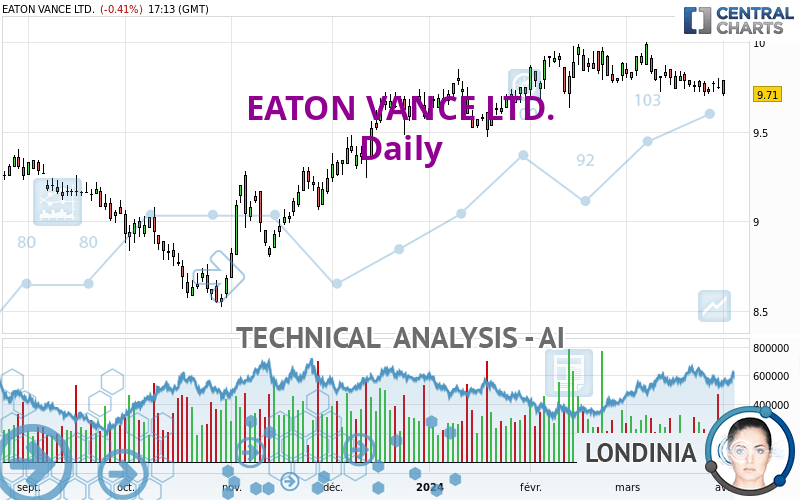
EATON VANCE LTD. - Daily - Technical analysis published on 04/01/2024 (GMT)
- 85
- 0
Click here for a new analysis!
- Timeframe : Daily
- - Analysis generated on
- Status : INVALID

Summary of the analysis

Additional analysis
Quotes
EATON VANCE LTD. rating 9.71 USD. The price registered a decrease of -0.41% on the session with the lowest point at 9.70 USD and the highest point at 9.79 USD. The deviation from the price is +0.10% for the low point and -0.82% for the high point.The Central Gaps scanner detects a bullish opening marking the presence of buyers ahead of sellers at the opening but not sufficiently marked to allow the price to register a quotation gap.
Bullish opening
Type : Bullish
Timeframe : Openning
Here is a more detailed summary of the historical variations registered by EATON VANCE LTD.:
Near a new HIGH record (1 year)
Type : Bullish
Timeframe : Weekly
Near a new LOW record (1st january)
Type : Bearish
Timeframe : Weekly
Near a new HIGH record (1 month)
Type : Bullish
Timeframe : Weekly
New LOW record (1 month)
Type : Bearish
Timeframe : Weekly
Technical
Technical analysis of EATON VANCE LTD. in Daily shows an overall bullish trend. 67.86% of the signals given by moving averages are bullish. Caution: the neutral signals currently given by the short-term moving averages indicate that this bullish trend is showing signs of running out of steam. The Central Indicators market scanner is currently detecting several bearish signals that could impact this trend:
Bearish trend reversal : Moving Average 20
Type : Bearish
Timeframe : Daily
Bearish price crossover with Moving Average 50
Type : Bearish
Timeframe : Daily
In fact, only 7 technical indicators out of 18 studied are currently positioned bearish. Caution: the Central Indicators scanner currently detects an excess:
CCI indicator is oversold : under -100
Type : Neutral
Timeframe : Daily
Williams %R indicator is oversold : under -80
Type : Neutral
Timeframe : Daily
Pivot points : price is under support 1
Type : Neutral
Timeframe : Daily
Price is back under the pivot point
Type : Bearish
Timeframe : Weekly
Central Patterns, the scanner specializing in chart patterns, did not identify any signals.
No result was found by the Central Candlesticks scanner on Japanese candlesticks.
| S3 | S2 | S1 | Price | R1 | R2 | R3 | |
|---|---|---|---|---|---|---|---|
| ProTrendLines | 9.03 | 9.54 | 9.70 | 9.71 | 9.91 | 10.68 | 11.02 |
| Change (%) | -7.00% | -1.75% | -0.10% | - | +2.06% | +9.99% | +13.49% |
| Change | -0.68 | -0.17 | -0.01 | - | +0.20 | +0.97 | +1.31 |
| Level | Major | Minor | Intermediate | - | Major | Intermediate | Minor |
To determine price objectives, it is also possible to use the pivot points. Here is the price position in relation to pivot points:
| Pivot points | S3 | S2 | S1 | PP | R1 | R2 | R3 |
|---|---|---|---|---|---|---|---|
| Standard | 9.67 | 9.70 | 9.73 | 9.76 | 9.79 | 9.82 | 9.85 |
| Camarilla | 9.73 | 9.74 | 9.75 | 9.75 | 9.76 | 9.76 | 9.77 |
| Woodie | 9.66 | 9.70 | 9.72 | 9.76 | 9.78 | 9.82 | 9.84 |
| Fibonacci | 9.70 | 9.73 | 9.74 | 9.76 | 9.79 | 9.80 | 9.82 |
| Pivot points | S3 | S2 | S1 | PP | R1 | R2 | R3 |
|---|---|---|---|---|---|---|---|
| Standard | 9.60 | 9.65 | 9.70 | 9.75 | 9.80 | 9.85 | 9.90 |
| Camarilla | 9.72 | 9.73 | 9.74 | 9.75 | 9.76 | 9.77 | 9.78 |
| Woodie | 9.60 | 9.65 | 9.70 | 9.75 | 9.80 | 9.85 | 9.90 |
| Fibonacci | 9.65 | 9.69 | 9.71 | 9.75 | 9.79 | 9.81 | 9.85 |
| Pivot points | S3 | S2 | S1 | PP | R1 | R2 | R3 |
|---|---|---|---|---|---|---|---|
| Standard | 9.43 | 9.56 | 9.66 | 9.79 | 9.89 | 10.02 | 10.12 |
| Camarilla | 9.69 | 9.71 | 9.73 | 9.75 | 9.77 | 9.79 | 9.81 |
| Woodie | 9.41 | 9.55 | 9.64 | 9.78 | 9.87 | 10.01 | 10.10 |
| Fibonacci | 9.56 | 9.65 | 9.71 | 9.79 | 9.88 | 9.94 | 10.02 |
Numerical data
The following is the status of technical indicators and moving averages registered at the time this technical analysis was created:
| RSI (14): | 46.09 | |
| MACD (12,26,9): | 0.0000 | |
| Directional Movement: | -1.27 | |
| AROON (14): | -57.14 | |
| DEMA (21): | 9.77 | |
| Parabolic SAR (0,02-0,02-0,2): | 9.87 | |
| Elder Ray (13): | -0.01 | |
| Super Trend (3,10): | 9.56 | |
| Zig ZAG (10): | 9.70 | |
| VORTEX (21): | 0.9800 | |
| Stochastique (14,3,5): | 20.93 | |
| TEMA (21): | 9.72 | |
| Williams %R (14): | -100.00 | |
| Chande Momentum Oscillator (20): | -0.13 | |
| Repulse (5,40,3): | -1.5900 | |
| ROCnROLL: | -1 | |
| TRIX (15,9): | 0.0200 | |
| Courbe Coppock: | 1.59 |
| MA7: | 9.74 | |
| MA20: | 9.78 | |
| MA50: | 9.71 | |
| MA100: | 9.42 | |
| MAexp7: | 9.74 | |
| MAexp20: | 9.76 | |
| MAexp50: | 9.67 | |
| MAexp100: | 9.47 | |
| Price / MA7: | -0.31% | |
| Price / MA20: | -0.72% | |
| Price / MA50: | -0% | |
| Price / MA100: | +3.08% | |
| Price / MAexp7: | -0.31% | |
| Price / MAexp20: | -0.51% | |
| Price / MAexp50: | +0.41% | |
| Price / MAexp100: | +2.53% |
About author
Online


Add a comment
Comments
0 comments on the analysis EATON VANCE LTD. - Daily