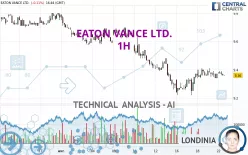
EATON VANCE LTD. - 1H - Technical analysis published on 04/22/2024 (GMT)
- 113
- 0
Click here for a new analysis!
- Timeframe : 1H
- - Analysis generated on
- Status : INVALID

Summary of the analysis

Additional analysis
Quotes
The EATON VANCE LTD. rating is 9.36 USD. On the day, this instrument lost -0.11% and was traded between 9.36 USD and 9.39 USD over the period. The price is currently at 0% from its lowest and -0.32% from its highest.The Central Gaps scanner detects a bullish opening marking the presence of buyers ahead of sellers at the opening but not sufficiently marked to allow the price to register a quotation gap.
Bullish opening
Type : Bullish
Timeframe : Openning
A study of price movements over other periods shows the following variations:
Near a new HIGH record (1 year)
Type : Bullish
Timeframe : Weekly
Near a new HIGH record (1st january)
Type : Bullish
Timeframe : Weekly
Near a new HIGH record (1 month)
Type : Bullish
Timeframe : Weekly
Technical
Technical analysis of this 1H chart of EATON VANCE LTD. indicates that the overall trend is bearish. The signals given by moving averages are 67.86% bearish. This bearish trend could slow down given the neutral signals currently being given by short-term moving averages. There is no crossing of moving average by the price or crossing of moving averages between themselves.
In fact, of the 18 technical indicators analysed by Central Analyzer, 6 are bullish, 10 are neutral and 2 are bearish. Central Indicators, the scanner specialised in technical indicators, has identified these signals:
Aroon indicator bearish trend
Type : Bearish
Timeframe : 1 hour
Momentum indicator is back over 0
Type : Bullish
Timeframe : 1 hour
The Central Patterns scanner, which studies chart patterns, resistances and supports, has identified this signal:
Near resistance of channel
Type : Bearish
Timeframe : 1 hour
Central Candlesticks, the scanner specialised in Japanese candlesticks, detects this inversion signal that could impact the current short-term trend:
Doji
Type : Neutral
Timeframe : 1 hour
| S3 | S2 | S1 | Price | R1 | R2 | R3 | |
|---|---|---|---|---|---|---|---|
| ProTrendLines | 9.22 | 9.27 | 9.34 | 9.36 | 9.41 | 9.50 | 9.62 |
| Change (%) | -1.50% | -0.96% | -0.21% | - | +0.53% | +1.50% | +2.78% |
| Change | -0.14 | -0.09 | -0.02 | - | +0.05 | +0.14 | +0.26 |
| Level | Intermediate | Intermediate | Minor | - | Minor | Intermediate | Major |
To determine price objectives, it is also possible to use the pivot points. Here is the price position in relation to pivot points:
| Pivot points | S3 | S2 | S1 | PP | R1 | R2 | R3 |
|---|---|---|---|---|---|---|---|
| Standard | 9.27 | 9.30 | 9.34 | 9.37 | 9.41 | 9.44 | 9.48 |
| Camarilla | 9.35 | 9.36 | 9.36 | 9.37 | 9.38 | 9.38 | 9.39 |
| Woodie | 9.27 | 9.30 | 9.34 | 9.37 | 9.41 | 9.44 | 9.48 |
| Fibonacci | 9.30 | 9.33 | 9.35 | 9.37 | 9.40 | 9.42 | 9.44 |
| Pivot points | S3 | S2 | S1 | PP | R1 | R2 | R3 |
|---|---|---|---|---|---|---|---|
| Standard | 8.97 | 9.10 | 9.23 | 9.36 | 9.49 | 9.62 | 9.75 |
| Camarilla | 9.30 | 9.32 | 9.35 | 9.37 | 9.39 | 9.42 | 9.44 |
| Woodie | 8.98 | 9.10 | 9.24 | 9.36 | 9.50 | 9.62 | 9.76 |
| Fibonacci | 9.10 | 9.20 | 9.26 | 9.36 | 9.46 | 9.52 | 9.62 |
| Pivot points | S3 | S2 | S1 | PP | R1 | R2 | R3 |
|---|---|---|---|---|---|---|---|
| Standard | 9.35 | 9.48 | 9.58 | 9.71 | 9.81 | 9.94 | 10.04 |
| Camarilla | 9.61 | 9.63 | 9.65 | 9.67 | 9.69 | 9.71 | 9.73 |
| Woodie | 9.33 | 9.47 | 9.56 | 9.70 | 9.79 | 9.93 | 10.02 |
| Fibonacci | 9.48 | 9.57 | 9.63 | 9.71 | 9.80 | 9.86 | 9.94 |
Numerical data
The following are the details of the technical indicators and moving averages that were collected to generate this technical analysis:
| RSI (14): | 51.49 | |
| MACD (12,26,9): | 0.0000 | |
| Directional Movement: | 5.98 | |
| AROON (14): | -64.29 | |
| DEMA (21): | 9.37 | |
| Parabolic SAR (0,02-0,02-0,2): | 9.35 | |
| Elder Ray (13): | 0 | |
| Super Trend (3,10): | 9.28 | |
| Zig ZAG (10): | 9.37 | |
| VORTEX (21): | 1.2000 | |
| Stochastique (14,3,5): | 47.62 | |
| TEMA (21): | 9.39 | |
| Williams %R (14): | -57.14 | |
| Chande Momentum Oscillator (20): | 0.01 | |
| Repulse (5,40,3): | 0.0200 | |
| ROCnROLL: | -1 | |
| TRIX (15,9): | 0.0100 | |
| Courbe Coppock: | 0.19 |
| MA7: | 9.36 | |
| MA20: | 9.50 | |
| MA50: | 9.62 | |
| MA100: | 9.46 | |
| MAexp7: | 9.37 | |
| MAexp20: | 9.36 | |
| MAexp50: | 9.38 | |
| MAexp100: | 9.44 | |
| Price / MA7: | -0% | |
| Price / MA20: | -1.47% | |
| Price / MA50: | -2.70% | |
| Price / MA100: | -1.06% | |
| Price / MAexp7: | -0.11% | |
| Price / MAexp20: | -0% | |
| Price / MAexp50: | -0.21% | |
| Price / MAexp100: | -0.85% |
About author
Online


Add a comment
Comments
0 comments on the analysis EATON VANCE LTD. - 1H