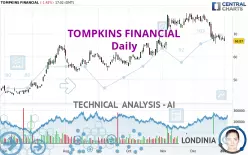
TOMPKINS FINANCIAL - Daily - Technical analysis published on 01/02/2025 (GMT)
- 108
- 0
Click here for a new analysis!
- Timeframe : Daily
- - Analysis generated on
- Status : TARGET REACHED

Summary of the analysis

Additional analysis
Quotes
TOMPKINS FINANCIAL rating 66.87 USD. The price registered a decrease of -1.42% on the session with the lowest point at 66.69 USD and the highest point at 68.87 USD. The deviation from the price is +0.27% for the low point and -2.90% for the high point.The Central Gaps scanner detects a bullish opening. A small advantage for buyers in the very short term.
Bullish opening
Type : Bullish
Timeframe : Openning
So that you have an overall view of the price change, here is a table showing the variations over several periods:
Near a new HIGH record (1st january)
Type : Bullish
Timeframe : Weekly
Near a new LOW record (1 month)
Type : Bearish
Timeframe : Weekly
Technical
A technical analysis in Daily of this TOMPKINS FINANCIAL chart shows a slightly bullish trend. 57.14% of the signals given by moving averages are bullish. Caution: the strong bearish signals currently given by short-term moving averages indicate that a trend reversal may be taking place. The Central Indicators scanner does not detect any result on moving averages that would impact this trend.
On the 18 technical indicators analysed, 4 are bullish, 4 are neutral and 10 are bearish. But beware of excesses. The Central Indicators scanner currently detects this:
Williams %R indicator is oversold : under -80
Type : Neutral
Timeframe : Daily
Pivot points : price is under support 1
Type : Neutral
Timeframe : Daily
Central Patterns, the market scanner focusing on chart patterns, resistances and supports found this result:
Horizontal resistance is broken
Type : Bullish
Timeframe : Daily
No result was found by the Central Candlesticks scanner on Japanese candlesticks.
| S3 | S2 | S1 | Price | R1 | R2 | R3 | |
|---|---|---|---|---|---|---|---|
| ProTrendLines | 55.44 | 60.96 | 64.51 | 66.87 | 67.86 | 71.87 | 74.80 |
| Change (%) | -17.09% | -8.84% | -3.53% | - | +1.48% | +7.48% | +11.86% |
| Change | -11.43 | -5.91 | -2.36 | - | +0.99 | +5.00 | +7.93 |
| Level | Intermediate | Major | Intermediate | - | Intermediate | Major | Intermediate |
Pivot points can also be used to set your price objectives. Here is the price situation in relation to pivot points:
| Pivot points | S3 | S2 | S1 | PP | R1 | R2 | R3 |
|---|---|---|---|---|---|---|---|
| Standard | 65.38 | 66.40 | 67.12 | 68.14 | 68.86 | 69.88 | 70.60 |
| Camarilla | 67.35 | 67.51 | 67.67 | 67.83 | 67.99 | 68.15 | 68.31 |
| Woodie | 65.22 | 66.33 | 66.96 | 68.07 | 68.70 | 69.81 | 70.44 |
| Fibonacci | 66.40 | 67.07 | 67.48 | 68.14 | 68.81 | 69.22 | 69.88 |
| Pivot points | S3 | S2 | S1 | PP | R1 | R2 | R3 |
|---|---|---|---|---|---|---|---|
| Standard | 61.33 | 63.54 | 65.75 | 67.96 | 70.17 | 72.38 | 74.59 |
| Camarilla | 66.76 | 67.16 | 67.57 | 67.97 | 68.38 | 68.78 | 69.19 |
| Woodie | 61.34 | 63.54 | 65.76 | 67.96 | 70.18 | 72.38 | 74.60 |
| Fibonacci | 63.54 | 65.23 | 66.27 | 67.96 | 69.65 | 70.69 | 72.38 |
| Pivot points | S3 | S2 | S1 | PP | R1 | R2 | R3 |
|---|---|---|---|---|---|---|---|
| Standard | 50.12 | 57.93 | 62.88 | 70.69 | 75.64 | 83.45 | 88.40 |
| Camarilla | 64.32 | 65.49 | 66.66 | 67.83 | 69.00 | 70.17 | 71.34 |
| Woodie | 48.69 | 57.22 | 61.45 | 69.98 | 74.21 | 82.74 | 86.97 |
| Fibonacci | 57.93 | 62.80 | 65.82 | 70.69 | 75.56 | 78.58 | 83.45 |
Numerical data
The following is the status of the technical indicators and moving averages at the time of publication of this technical analysis:
| RSI (14): | 36.91 | |
| MACD (12,26,9): | -1.4900 | |
| Directional Movement: | -12.07 | |
| AROON (14): | -57.14 | |
| DEMA (21): | 69.30 | |
| Parabolic SAR (0,02-0,02-0,2): | 69.17 | |
| Elder Ray (13): | -2.00 | |
| Super Trend (3,10): | 75.02 | |
| Zig ZAG (10): | 66.98 | |
| VORTEX (21): | 0.8100 | |
| Stochastique (14,3,5): | 14.34 | |
| TEMA (21): | 66.67 | |
| Williams %R (14): | -91.02 | |
| Chande Momentum Oscillator (20): | -9.56 | |
| Repulse (5,40,3): | -3.7100 | |
| ROCnROLL: | 2 | |
| TRIX (15,9): | -0.1500 | |
| Courbe Coppock: | 21.93 |
| MA7: | 68.21 | |
| MA20: | 72.33 | |
| MA50: | 71.56 | |
| MA100: | 65.08 | |
| MAexp7: | 68.35 | |
| MAexp20: | 70.85 | |
| MAexp50: | 70.12 | |
| MAexp100: | 66.00 | |
| Price / MA7: | -1.96% | |
| Price / MA20: | -7.55% | |
| Price / MA50: | -6.55% | |
| Price / MA100: | +2.75% | |
| Price / MAexp7: | -2.17% | |
| Price / MAexp20: | -5.62% | |
| Price / MAexp50: | -4.63% | |
| Price / MAexp100: | +1.32% |
News
Don't forget to follow the news on TOMPKINS FINANCIAL. At the time of publication of this analysis, the latest news was as follows:
- Tompkins Financial Corporation Reports Second Quarter Earnings
- Tompkins Financial Corporation Reports Cash Dividend
- Tompkins Financial Corporation Announces Stock Repurchase Program
- Matthew Tomazin Named Chief Financial Officer of Tompkins Financial Corp.
- Tompkins Financial Corp. Announces Chief Financial and Chief Operating Officer Francis M. Fetsko to Retire
About author
Online


Add a comment
Comments
0 comments on the analysis TOMPKINS FINANCIAL - Daily