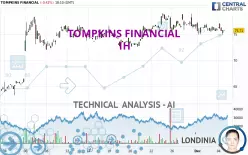
TOMPKINS FINANCIAL - 1H - Technical analysis published on 12/04/2024 (GMT)
- 77
- 0
Click here for a new analysis!
- Timeframe : 1H
- - Analysis generated on
- Status : INVALID

Summary of the analysis

Additional analysis
Quotes
TOMPKINS FINANCIAL rating 75.71 USD. The price is lower by -0.43% since the last closing and was between 74.89 USD and 77.01 USD. This implies that the price is at +1.09% from its lowest and at -1.69% from its highest.A bullish opening was detected by the Central Gaps scanner. Buyers are trying to impose a bullish momentum in the very short term.
Bullish opening
Type : Bullish
Timeframe : Openning
Here is a more detailed summary of the historical variations registered by TOMPKINS FINANCIAL:
Near a new HIGH record (1 year)
Type : Bullish
Timeframe : Weekly
Near a new HIGH record (1st january)
Type : Bullish
Timeframe : Weekly
Near a new HIGH record (1 month)
Type : Bullish
Timeframe : Weekly
Technical
A technical analysis in 1H of this TOMPKINS FINANCIAL chart shows a neutral trend. This indecision could turn into a bearish trend due to the strong bearish signals currently being given by short-term moving averages. The Central Indicators scanner detects bullish and bearish signals on moving averages that could impact this trend:
Bearish trend reversal : adaptative moving average 50
Type : Bearish
Timeframe : 1 hour
Bullish price crossover with Moving Average 100
Type : Bullish
Timeframe : 1 hour
Bearish price crossover with adaptative moving average 100
Type : Bearish
Timeframe : 1 hour
An assessment of technical indicators does not currently provide any relevant information on the direction of future price movements.
The Central Indicators scanner found this result concerning these indicators:
Price is back under the pivot point
Type : Bearish
Timeframe : Weekly
An analysis of the price chart with the Central Patterns scanner (detector of chart patterns and resistances and supports) shows several results that can have an impact on the price change:
Near horizontal resistance
Type : Bearish
Timeframe : 1 hour
Near resistance of triangle
Type : Bearish
Timeframe : 1 hour
Resistance of channel is broken
Type : Bullish
Timeframe : 1 hour
For a small setback in the very short term, the Central Candlesticks scanner currently notes the presence of this bearish pattern in Japanese candlesticks:
Bearish harami cross
Type : Bearish
Timeframe : 1 hour
| S3 | S2 | S1 | Price | R1 | R2 | R3 | |
|---|---|---|---|---|---|---|---|
| ProTrendLines | 64.51 | 69.01 | 74.80 | 75.71 | 77.49 | 78.94 | 80.80 |
| Change (%) | -14.79% | -8.85% | -1.20% | - | +2.35% | +4.27% | +6.72% |
| Change | -11.20 | -6.70 | -0.91 | - | +1.78 | +3.23 | +5.09 |
| Level | Intermediate | Intermediate | Major | - | Major | Intermediate | Intermediate |
To determine price objectives, it is also possible to use the pivot points. Here is the price position in relation to pivot points:
| Pivot points | S3 | S2 | S1 | PP | R1 | R2 | R3 |
|---|---|---|---|---|---|---|---|
| Standard | 74.33 | 74.83 | 75.43 | 75.93 | 76.53 | 77.03 | 77.63 |
| Camarilla | 75.74 | 75.84 | 75.94 | 76.04 | 76.14 | 76.24 | 76.34 |
| Woodie | 74.39 | 74.86 | 75.49 | 75.96 | 76.59 | 77.06 | 77.69 |
| Fibonacci | 74.83 | 75.25 | 75.51 | 75.93 | 76.35 | 76.61 | 77.03 |
| Pivot points | S3 | S2 | S1 | PP | R1 | R2 | R3 |
|---|---|---|---|---|---|---|---|
| Standard | 70.54 | 72.75 | 74.60 | 76.81 | 78.66 | 80.87 | 82.72 |
| Camarilla | 75.34 | 75.72 | 76.09 | 76.46 | 76.83 | 77.20 | 77.58 |
| Woodie | 70.37 | 72.66 | 74.43 | 76.72 | 78.49 | 80.78 | 82.55 |
| Fibonacci | 72.75 | 74.30 | 75.26 | 76.81 | 78.36 | 79.32 | 80.87 |
| Pivot points | S3 | S2 | S1 | PP | R1 | R2 | R3 |
|---|---|---|---|---|---|---|---|
| Standard | 50.24 | 56.51 | 66.48 | 72.75 | 82.72 | 88.99 | 98.96 |
| Camarilla | 71.99 | 73.48 | 74.97 | 76.46 | 77.95 | 79.44 | 80.93 |
| Woodie | 52.10 | 57.44 | 68.34 | 73.68 | 84.58 | 89.92 | 100.82 |
| Fibonacci | 56.51 | 62.71 | 66.54 | 72.75 | 78.95 | 82.78 | 88.99 |
Numerical data
The following are the details of the technical indicators and moving averages that were collected to generate this technical analysis:
| RSI (14): | 43.53 | |
| MACD (12,26,9): | -0.1700 | |
| Directional Movement: | -6.51 | |
| AROON (14): | -14.29 | |
| DEMA (21): | 75.92 | |
| Parabolic SAR (0,02-0,02-0,2): | 77.01 | |
| Elder Ray (13): | -0.70 | |
| Super Trend (3,10): | 77.56 | |
| Zig ZAG (10): | 75.75 | |
| VORTEX (21): | 0.8500 | |
| Stochastique (14,3,5): | 31.14 | |
| TEMA (21): | 75.66 | |
| Williams %R (14): | -63.16 | |
| Chande Momentum Oscillator (20): | -0.69 | |
| Repulse (5,40,3): | 0.0000 | |
| ROCnROLL: | 2 | |
| TRIX (15,9): | -0.0300 | |
| Courbe Coppock: | 0.85 |
| MA7: | 76.32 | |
| MA20: | 75.30 | |
| MA50: | 66.89 | |
| MA100: | 62.43 | |
| MAexp7: | 75.86 | |
| MAexp20: | 76.10 | |
| MAexp50: | 76.07 | |
| MAexp100: | 75.01 | |
| Price / MA7: | -0.80% | |
| Price / MA20: | +0.54% | |
| Price / MA50: | +13.19% | |
| Price / MA100: | +21.27% | |
| Price / MAexp7: | -0.20% | |
| Price / MAexp20: | -0.51% | |
| Price / MAexp50: | -0.47% | |
| Price / MAexp100: | +0.93% |
News
Don't forget to follow the news on TOMPKINS FINANCIAL. At the time of publication of this analysis, the latest news was as follows:
- Tompkins Financial Corporation Reports Second Quarter Earnings
- Tompkins Financial Corporation Announces Stock Repurchase Program
- Tompkins Financial Corporation Reports Cash Dividend
- Matthew Tomazin Named Chief Financial Officer of Tompkins Financial Corp.
- Tompkins Financial Corp. Announces Chief Financial and Chief Operating Officer Francis M. Fetsko to Retire
About author
Online


Add a comment
Comments
0 comments on the analysis TOMPKINS FINANCIAL - 1H